Color Levels
The Color Levels options are used to control which colors are displayed at different density levels on a Density or Contour plot. The significance of each color level can be displayed in the plot legend. In Version 4, 25 discrete color levels were used to generate gradients in Density and Contour Plots. In in Version 5, Density plots are rendered in 256 discrete color levels, resulting in a smoother color gradient.
You can edit the Color Levels for Density or Contour plots in one of two ways:
| • | Select a Density or Contour plot and use the Format→2D Options→Color Levels command (Figure 8.75). |
| • | Right-click on a Density or Contour plot, select Format from the pop-up menu, and choose Density Options→Color Levels or Contour Options→Color Levels. |

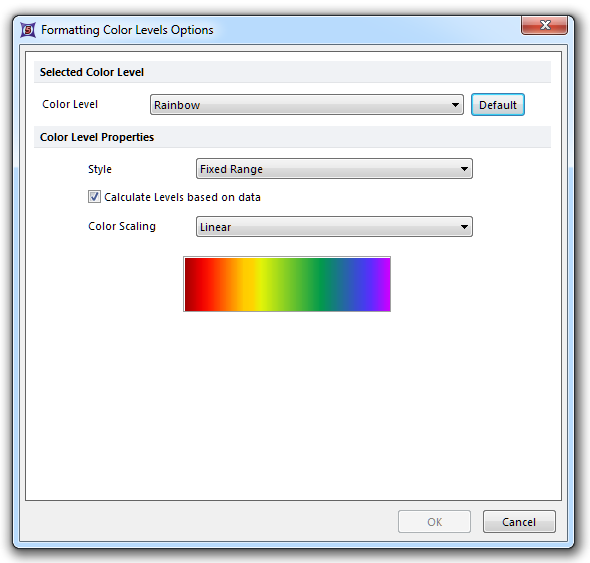
Figure 8.76 Contour Level Options
Selected Color Level
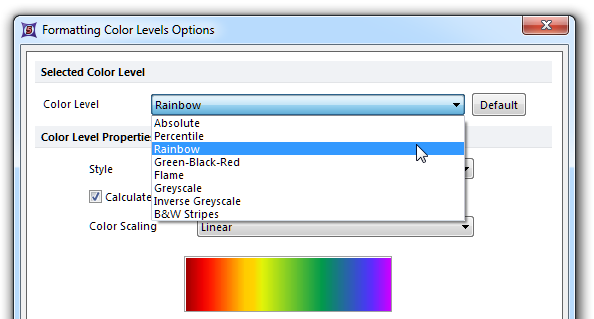
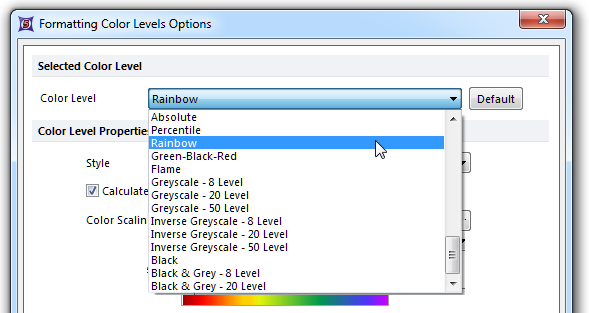
Select the color spectrum from the Color Level drop-down list. Rainbow is the default for both Density and Contour plots. However, the choices in the list differ for each type of plot, though both have color, grayscale, and black & white options (Figs. 8.76 and 8.77).

Figure 8.78 Color Level choices for density plots

Figure 8.79 Color Level choices for contour plots
When you select a color level category, the colors in the chosen spectrum will be displayed in the bottom half of the dialog. In addition, the Preview and Restore buttons in the Format dialog provide a convenient means for evaluating each color scheme with your data. Most of these Color Levels are self-explanatory, but two bear explanation:
| • | Absolute |
The density line color will depend on whether the number of cells is less than the value in the value field.
| • | Percentile |
The density line color will depend on whether the number of cells is less than x percent of the total number of cells, where x is the value in the value field.
The color for an individual level can be changed by selecting the color and clicking the ellipsis inside the color box. A level can be added or removed by selecting the appropriate level and pressing the ![]() (Add) or
(Add) or ![]() (Remove) buttons. To access these settings for plots displaying Color Levels other than Absolute and Percentile, uncheck Calculate levels based on data.
(Remove) buttons. To access these settings for plots displaying Color Levels other than Absolute and Percentile, uncheck Calculate levels based on data.
When selecting grayscale, the shades of gray are automatically displayed for you. You will not be able to edit the shades for an existing level. If you press ![]() to add a level while in grayscale, you will be prompted to assign a new shade from the full range of colors (not grayscale levels) available on your computer.
to add a level while in grayscale, you will be prompted to assign a new shade from the full range of colors (not grayscale levels) available on your computer.
You can return to the Rainbow style (or your current default option for 2D Contour or Density plots) by clicking on the Default button. Clicking the Default button will also update any plots created in a Version 4 layout to the new default color palette for Version 5.
Color Level Properties
From the Style drop-down list, choose whether the colors should vary according to a Fixed Range, Percentile, Mean +/- SD, or Threshold. The Standard Deviation and Threshold must be entered in manually at the bottom of the dialog window for the two last styles, respectively.
Color Scaling may be specified as Linear or Logarithmic.
