Data Navigator
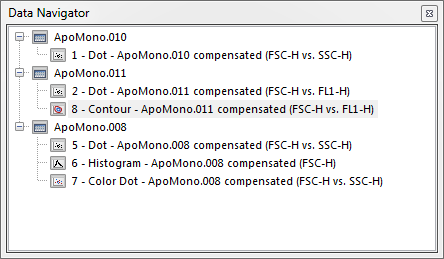
The Data Navigator shows a hierarchical view of all of the data currently showing on your layout. Within each data node, plots and other data grids displaying the data are shown. (Figure 4.28).

Figure 4.28 Data Navigator
The first level of hierarchy in the Data Navigator represents the data set nodes. The second level is the plots and/or data grids associated with the data sets. Hovering the mouse cursor over a plot or data grid in a docked Data Navigator window displays a thumbnail view of the object.
Click on a node to expand it. While holding the mouse button down, drag and object stemming from the node to your layout and release the mouse button. The results of drag and drop operations from the Data Navigator are described in the table below.
Drag and Drop Operation from Data Navigator |
Function |
|---|---|
Drag a data set to an existing plot |
Adds data to the plot. You will be prompted whether to replace the existing data or add it as a new overlay. |
Drag a data set to an empty part of the layout |
Brings up the Select plot types... dialog to open plot(s) using this data set. |
Drag an object to an empty part of the layout |
Moves the object to the new location. |
Drag an object onto an existing object in the layout |
Adds the appropriate data to the existing object. You will be prompted to choose special paste format options. |
Within the navigator, drag a plot onto another plot |
Brings up a Paste Special dialog to insert data or overlays. |
