The Data Tab
The Data Tab (Figure 3.17) contains five groups:

Figure 3.17 Data Tab
| • | Save/Load |
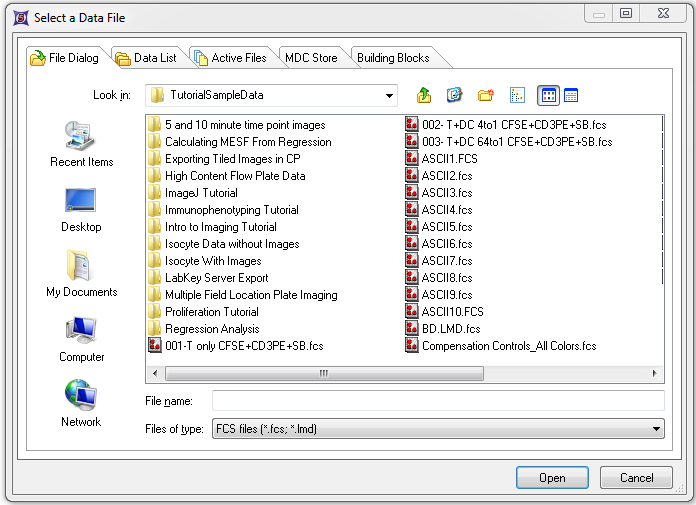
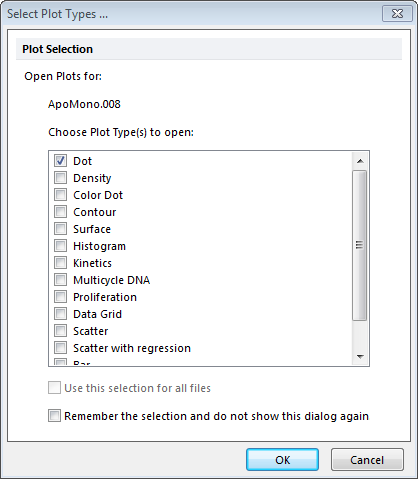
| o | The Open command brings up the Select a Data File dialog (Figure 3.18) which allows you to select a data set (e.g., an FCS file) and choose which type of plot(s) to open from the Select Plot Types dialog (Figure 3.19). The Select a Data File dialog contains a File Dialog tab for accessing files anywhere on your computer, a Data List tab which allows you to see which files/data sets you are working with in the current experiment, an Active Files tab (i.e., the files currently open in the layout), an MDC Store tab (accessing files from the Molecular Devices MDC Store (Image Cytometry Version)) and a Building Blocks tab (accessing files from PerkinElmer building blocks (Image Cytometry Version)). Using the Files of type: drop-down list, you can choose the file extension, e.g., files from different instrument manufacturers. |

Figure 3.18 Select a Data File Dialog

Figure 3.19 Select Plot Types Dialog
| o | The Custom Data command allows you to create new custom data. |
| o | With the Export command, you export the data from a single open file. |
| o | You can export data from multiple files consecutively using the Batch Export command. |
| • | Data Info |
| o | If a plot is selected, the View Header command brings up a dialog box which displays the FCS file header information for that file. If no plot exists on the layout, the Select a Data File dialog is displayed so that you can choose which header information to display. |
| o | The Keywords Anonymizer command brings up the Select Keywords to Anonymize window which allows you to remove any or all keywords from a data file. |
| o | Clicking on the Compensations command opens the Compensations Navigator which allows you to display the compensation information on the selected file, create new compensations, and load or save compensation information. |
| • | Calculate |
| o | Parameter Math opens a menu containing Single Calculation, Sequence Setup, Run Sequence, Load Sequence, and Save Sequence commands. These items allow you to define a single or sequence of math functions, save the functions, and apply the functions to data files. |
| o | The Histogram Subtraction command allows you to apply four mathematical methods of comparing sample and control histograms. |
| • | Organize Data Sets |
| o | The Panels command brings up the Panel Information dialog for working with panels. |
| o | In the Increment Value field, you can set the number of files to increment after each iteration in a batch process, or when pressing Next/Prev on Selection or All Objects (below). An increment value of 1 means to move to the next file in the Data List. |
| o | The Data List command brings up the dockable Data List window to process the list of current data sets. |
| o | Previous changes the .fcs file to the previous file in the Data List on the selected plot or plots. |
| o | Next changes the .fcs file to the next file in the Data List on the selected plot or plots. |
| o | Select brings up the Select a Data File dialog so that you can choose an .fcs file to display in the selected plot or plots. |
| o | Previous changes the .fcs file to the previous file in the Data List on all plots. |
| o | Next changes the .fcs file to the next file in the Data List on all plots. |
| o | Select brings up the Select a Data File dialog so that you can choose an .fcs file to display in all plots. |
| o | Flag this iteration |
| o | Apply Iteration Snapshot |
| o | Iteration allows you to choose an iteration from a dropdown menu that will be displayed in all plots. |
