Define Custom Tokens
For this tutorial, we will be using a layout file that has 2D density plots with defined gates from seven data files, each having different amounts of CD64 antibody. At anytime if you would like to skip ahead to the Create a Custom Data Table section the steps from the tutorial have been completed in a new layout for the next section.
| 1. | Select the File tab→Open From→Open. |
| 2. | Open the layout Titration.fey found in the FCS Express Sample Data folder. |
The following layout should appear as shown in Figure T17.1.
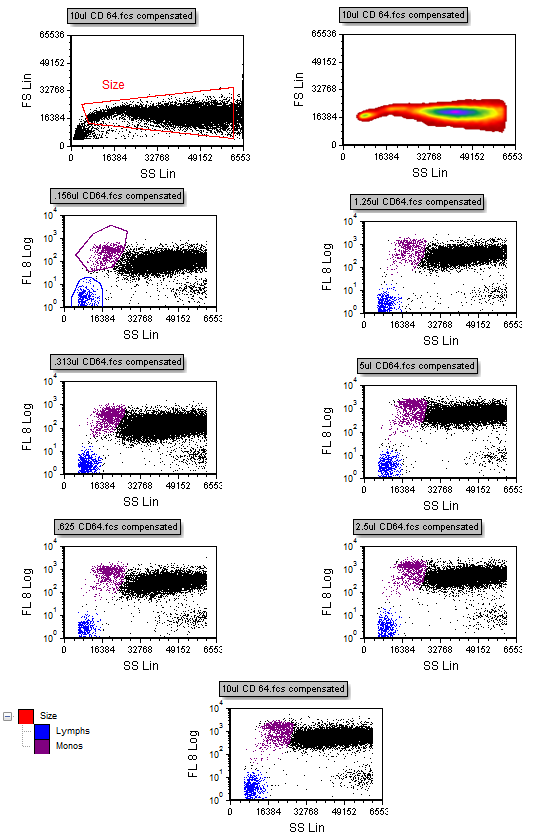
Figure T17.1 Titration Layout
In the upper left corner of the layout is a dot plot of Side Scatter versus Forward Scatter with a scatter gate, drawn in red. The Scatter gate has been defined to exclude very low and very high scatter signals. All the other plots on the layout are gated using this Scatter gate. Seven different volumes of CD64 were added to peripheral blood mononuclear cells and are shown in the seven color dot plots. To define the negative population for this titration experiment, a gate has been drawn on the lymphocyte population, shown in blue as the Lymphs gate, in the 2D plot of Side Scatter (SS Lin) versus CD64 (FL 8 Log). The positive population is the monocyte population which is defined in purple as the Monos gate. In the lower left corner of the layout is the Gate View window showing that the Lymphs and Mono gates are children of the Scatter gate, meaning the data is first gated using the Scatter gate and then the Lymphs and Mono gates are applied.
We will now define the custom tokens for each of the seven volumes of CD64 used in order to calculate a CD64 signal to noise ratio. The custom tokens will be defined as the ratio of the median CD64 fluorescent intensity of the monocyte population (the positive population) divided by the median CD64 fluorescent intensity of the lymphocyte population (the negative population).
| 3. | Select the View→Tokens→Custom Tokens command (Figure T17.2). |

Figure T17.2 Selecting the Custom Tokens Command
The Custom Tokens window now appears on the layout. We will now dock the window to the left side of the layout. For more information on docking, please refer to the Docking tutorial.
| 4. | Place the cursor on the top border of the Custom Tokens window. |
| 5. | Press and hold the left mouse button. |
| 6. | Continue to hold the left button while dragging the Custom Tokens window towards the left arrow of the Docking arrows icon. |
| 7. | Release the button when the cursor is over the left arrow of the Docking arrows icon, as indicated by the cursor in Figure T17.3. |
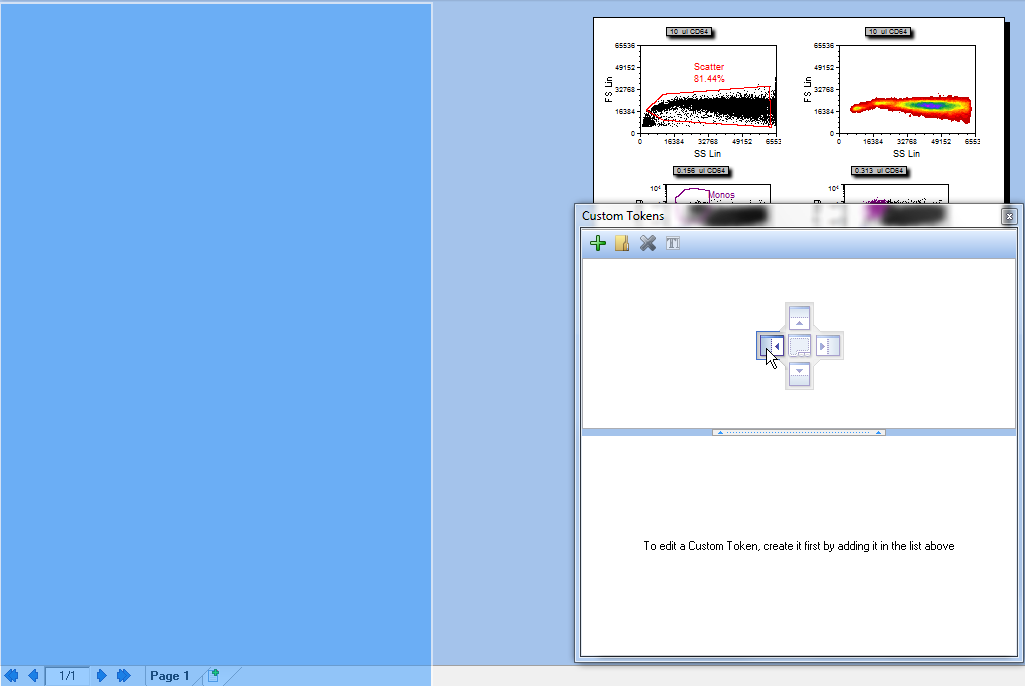
Figure T17.3 Docking the Custom Tokens Window
The Custom Tokens window is now docked on the left side of the layout. We will now begin defining the custom tokens. For more information on creating custom tokens, please refer to the Using Text Boxes and Tokens tutorial.
| 8. | Left-click on the "+" symbol on the top border of the Custom Tokens window, indicated by the cursor in Figure T17.4. |
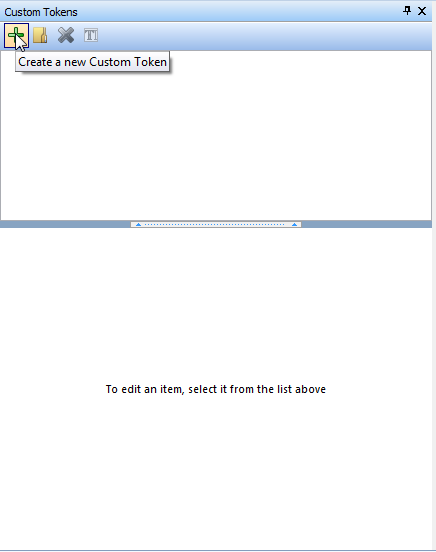
Figure T17.4 Creating a New Custom Token
A new Custom Token appears in the top half of the Custom Tokens window, shown highlighted in blue in Figure T17.5.
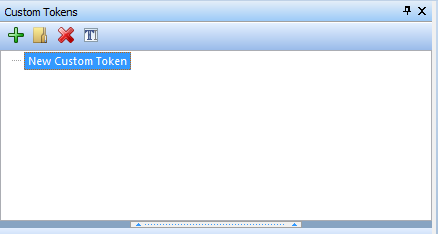
Figure T17.5 New Custom Token
| 9. | Left-click on the New Custom Token to edit it. |
| 10. | Type '0.156 ratio'. |
| 11. | Press Enter. The 0.156 ratio will be highlighted in blue. |
| 12. | Left-click inside the lower half of the Custom Tokens Window, under Enter Custom Token formula below. |
| 13. | Type '=' (Figure T17.6). |
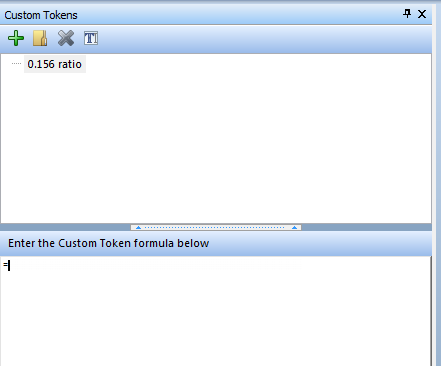
Figure T17.6 Beginning the Custom Token Formula
| 14. | Right-click next to the '=' to bring up the pop-up menu. |
| 15. | Select Insert Token from the pop-up menu, indicated by the cursor in Figure T17.7. |
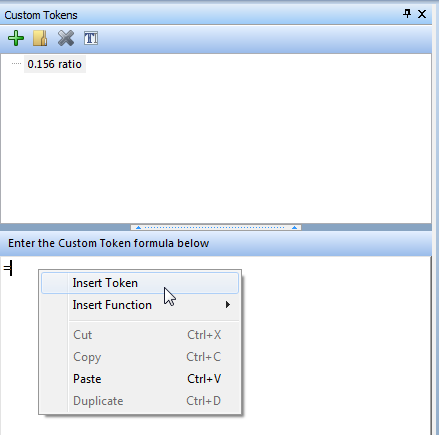
Figure T17.7 Insert Token Item from the Pop-up Menu
The Insert a Token dialog appears (Figure T17.8).
| 16. | Select Statistic, shown highlighted in blue in Figure T17.8. |
| 17. | Click Insert. |
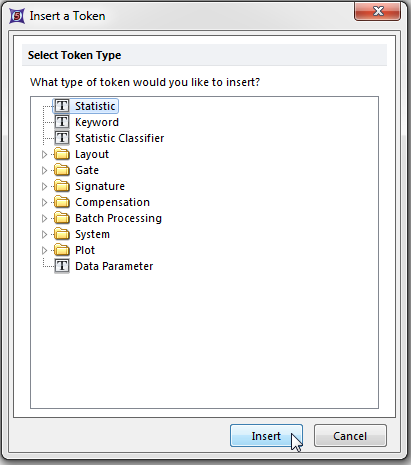
Figure T17.8 Insert a Token Dialog
The Create Statistic dialog, with the Data Source category, appears, similar to Figure T17.9. This is where we will select the data source to use in the custom token definition.
| 18. | Select Color Dot - .156ul CD64.fcs.DNS (SS Lin vs. FL 8 Log), shown highlighted in blue in Figure T17.9. |
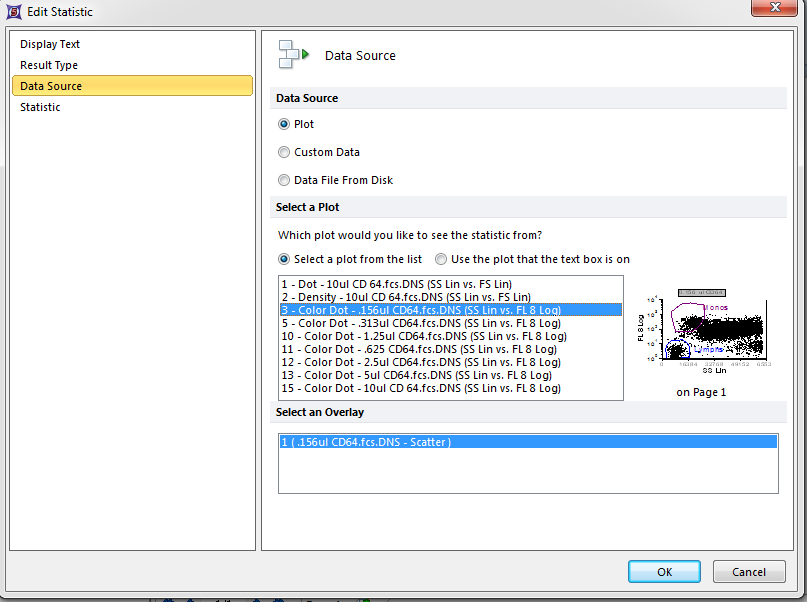
Figure T17.9 Create Statistic Dialog -- Data Source
| 19. | Select the Statistic category on the left, indicated by the cursor in Figure T17.9. |
The Statistic page of the Create Statistic dialog now appears, similar to Figure T17.10.
| 20. | Select Monos from the Gate: drop-down list. |
| 21. | Select Y-median from the Statistics: list box. |
| 22. | Select OK. |
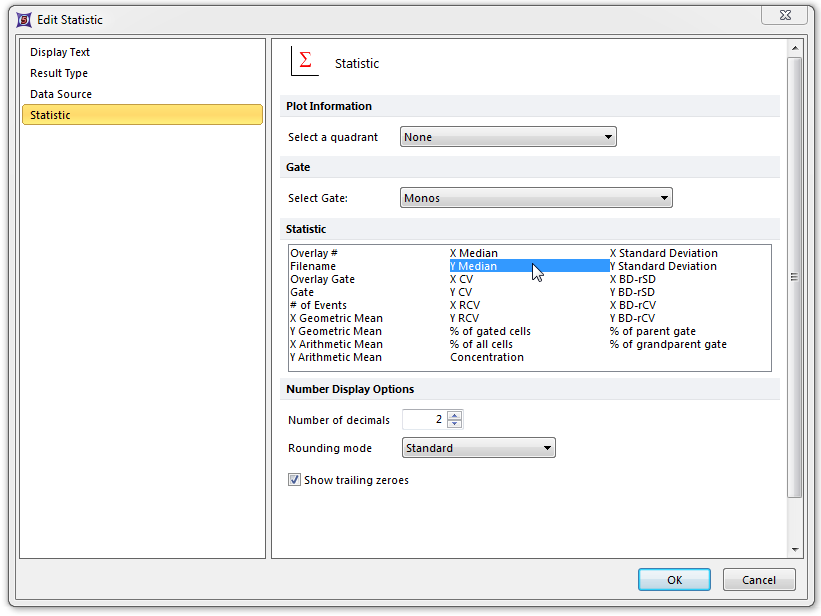
Figure T17.10 Create Statistic Dialog -- Statistic Category
The Custom Tokens definition of '0.156 ratio' updates to reflect the changes made, shown in Figure T17.11.
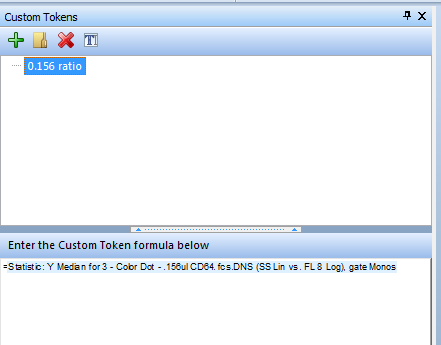
Figure T17.11 Numerator Definition of Custom Token '0.156 Ratio'
We have now defined the numerator, the positive population, of the 0.156 ratio custom token. Now we will define the denominator, the negative population, of the custom token.
| 23. | Type '/' after the text 'Statistic: Y Median for Plot #3, overlay #1, Additional Gate: Monos' in the Custom Token formula window. Note: '/' is the division symbol, just like in Microsoft Excel. |
| 24. | Select the text 'Statistic: Y Median for Plot #3, overlay #1, Additional Gate: Monos'. |
| 25. | Copy the text using Ctrl+C on the keyboard. |
Alternatively the text can be copied using the pop-up menu.
| • | Right-click after selecting the token to bring up the pop-up menu. |
| • | Select Copy Text from the pop-up menu. |
| 26. | Place the cursor after the '/' symbol and left click. |
| 27. | Paste the custom token text using Ctrl+V on the keyboard. |
Alternatively the text can be pasted using the pop-up menu.
| • | Right-click after the '/' symbol to bring up the pop-up menu. |
| • | Select Paste Text from the pop-up menu. |
The Custom Token formula definition updates to reflect the copying and pasting of the numerator text statistic to the denominator. We will now edit the denominator definition.
| 28. | Double-click on the newly pasted denominator token, in the Custom Token definition window. |
The Edit Statistic dialog appears, similar to the Create Statistic dialog previously shown in Figure T17.9. We will now modify the definition to use the Lymphs gate; we do not need to edit the Data Source page because we are still using the same plot.
| 29. | Select Statistic from the category section of the Edit Statistic dialog. |
The Statistic page of the Edit Statistic dialog appears, again similar to the Create Statistic dialog previously shown in Figure T17.10; however, this time we will select the Lymphs gate.
| 30. | Select Lymphs from the Gate: drop-down list. |
| 31. | Select OK. |
The Custom Token formula for 0.156 ratio updates to reflect the changes made, as shown in Figure T17.12.
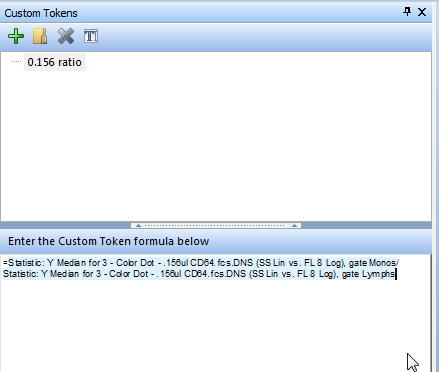
Figure T17.12 Custom Token Formula for 0.156 ratio
We will now create a Custom Token formula for the 0.313μl CD64 data. However, instead of using copy and paste to define the Custom Token, we will drag and drop the color dot plot of 0.313μl CD64 onto the lower half of the Custom Tokens window.
| 32. | Left-click on the "+" symbol on the top border of the Custom Tokens window, indicated by the cursor in Figure T17.4. |
| 33. | Type '0.313 ratio' inside the New Custom Token text. |
| 34. | Press Enter; 0.313 ratio will be highlighted in blue. |
| 35. | Left-click inside the lower half of the Custom Tokens window, under Enter Custom Token formula below. |
| 36. | Type '=' (Figure T17.6). |
| 37. | Place the cursor over the plot of 0.313ul CD64, shown with a red border in Figure T17.13. |
| 38. | Press and hold the left mouse button. |
| 39. | Continue to hold the left button and drag the plot onto the lower half of the Custom Tokens window. |
| 40. | Release the left button when the plot is to the right of the '=', indicated by the cursor in Figure T17.13. |
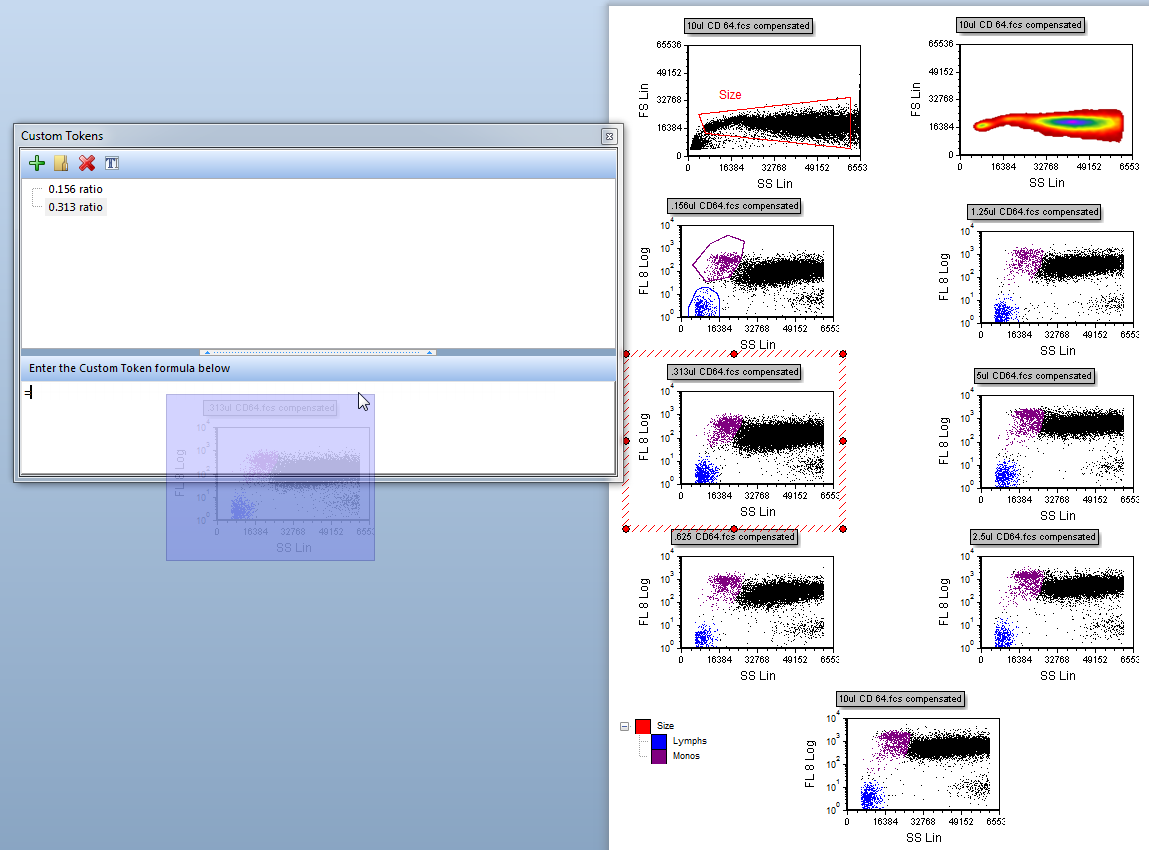
Figure T17.13 Dragging and Dropping the 0.313μl CD64 Plot onto the Custom Token Formula
The Paste Special dialog will appear as shown in Figure T17.14.
| 41. | Select Statistic token, shown highlighted in blue in Figure T17.14. |
| 42. | Click OK. |
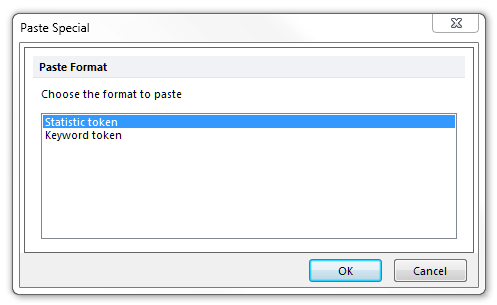
Figure T17.14 Paste Special Dialog
The Statistic page of the Edit Statistic dialog appears, again similar to the Create Statistic dialog previously shown in Figure T17.10. Again,n we will use the same statistic settings shown in Figure T17.10 to define the numerator of 0.313 ratio Custom Token. The Data source has already been set to the 0.313μl CD64 plot when we dragged and dropped the plot onto the Custom Tokens definition window. Refer to Figure T17.10 for the following steps
| 43. | Select Monos from the Gate: drop-down list . |
| 44. | Select Y-median from the Statistics: list box. |
| 45. | Select OK. |
We have defined the numerated for the 0.313 ratio Custom Token. Now, we will define the denominator, again dragging and dropping the plot of 0.313ul CD64.
| 46. | Type '/' after the text 'Statistic: Y Median for Plot #5, overlay #1, Additional Gate: Monos' in the Custom Token formula window. |
| 47. | Place the cursor over the plot of 0.313ul CD64, shown with red border in Figure T17.13. |
| 48. | Press and hold the left mouse button. |
| 49. | Continue to hold the left button and drag the plot onto lower half of the Custom Tokens window. |
| 50. | Release the left button when the plot is to the right of the '/'. |
The Paste Special dialog will appear again, as previously shown in Figure T17.14.
| 51. | Select Statistic token, shown highlighted in blue in Figure T17.14. |
| 52. | Click OK. |
The Statistic page of the Edit Statistic dialog appears, similar to the Create Statistic dialog previously shown in Figure T17.10. Again, we will use the Y-median as the statistics option. However, now we will select the Lymphs gate to define the denominator.
| 53. | Select Lymphs from the Gate: drop-down list. |
| 54. | Select Y-median from the Statistics: list box. |
| 55. | Select OK. |
The Custom Tokens window should now appear similar to Figure T17.15, with the definitions for Custom Tokens for 0.156 ratio and 0.313 ratio.
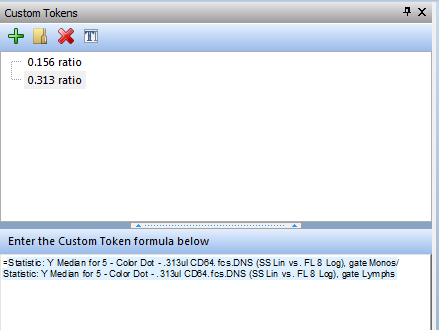
Figure T17.15 Custom Token Definitions for the First Two CD64 Concentrations
Now we will define the Custom Token for the 0.625μl CD64 data. Instead of defining the Custom Token from the beginning, we will copy and paste the definition of the 0.313 ratio Custom Token.
| 56. | Left-click on the "+" symbol on the top border of the Custom Tokens window. |
| 57. | Type '0.625 ratio' in the New Custom Token text. |
| 58. | Hit Enter; 0.625 ratio will be highlighted in blue. |
| 59. | Select 0.313 ratio in the Custom Tokens upper window. |
| 60. | Place the cursor in the lower half of the Custom Tokens window before the '='. |
| 61. | Press and hold the left mouse button and select the text definition of the 0.313 ratio Custom Token. |
| 62. | Copy the text using Ctrl+C on the keyboard. |
| 63. | Select the 0.625 ratio in the Custom Tokens upper window. |
| 64. | Place the cursor in the lower half of the Custom Tokens window. |
| 65. | Paste the text using Ctrl+V on the keyboard. |
| 66. | Place the cursor over the text defining the numerator 'Statistic: Y Median for Plot #5, overlay #1, Additional Gate: Monos'. |
| 67. | Double-click to bring up the Edit Statistic dialog, Data Source category. |
| 68. | Select the Color Dot - 0.625ul CD64.fcs.DNS (SS Lin vs. FL 8 Log). |
| 69. | Select OK. |
| 70. | Place the cursor over the text defining the denominator 'Statistic: Y Median for Plot #5, overlay #1, Additional Gate: Lymphs'. |
| 71. | Double-click to bring up the Edit Statistic dialog, Data Source category, similar to the Create Statistic dialog previously shown in Figure T17.9. |
| 72. | Select the Color Dot - 0.625ul CD64.fcs.DNS (SS Lin vs. FL 8 Log). |
| 73. | Select OK. |
The 0.625 ratio Custom Token has now been defined to use the 0.625μl CD64 data. We will now use copy and paste in the pop-up menu to define the 1.25 ratio token using the definition of the 0.625 ratio Custom Token.
| 74. | Place the cursor over the 0.625 ratio text in the Custom Tokens window. |
| 75. | Right-click to bring up the pop-up menu. |
| 76. | Select Copy Custom Token(s) from the pop-up menu (Figure T17.16). |
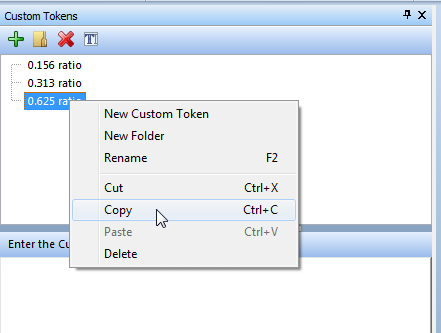
Figure T17.16 Copy Custom Token(s) Item in the Pop-up Menu
| 77. | Place the cursor under the 0.625 ratio text in the Custom Tokens window. |
| 78. | Right-click to bring up the pop-up menu. |
| 79. | Select Paste Custom Token(s) from the pop-up menu (Figure T17.17). |
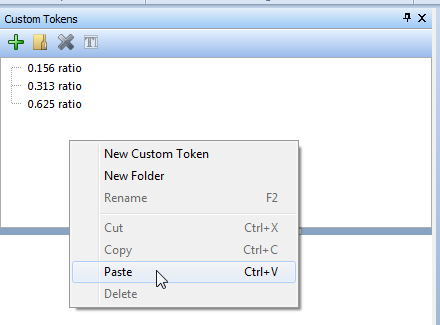
Figure T17.17 Paste Custom Token(s) Item in the Pop-up Menu
The 0.625 ratio custom token now appears twice. We now need to edit both the name of this custom token and the definition to use the 1.25μl CD64 plot data.
| 80. | Place the cursor over the text 0.625 ratio in the Custom Tokens window, shown highlighted in Figure T17.18. |
| 81. | Right-click to bring up the pop-menu. |
| 82. | Select Rename from the pop-up menu. |
| 83. | Type '1.25 ratio'. |
| 84. | Place the cursor in the lower half of the Custom Tokens window over the token defining the numerator 'Statistic: Y Median for Plot #11, overlay #1, Additional Gate: Monos', indicated by the cursor in Figure T17.18. |
| 85. | Double-click to bring up the Edit Statistic dialog, Data Source category. |
| 86. | Select the Color Dot - 1.25ul CD64.fcs.DNS (SS Lin vs. FL 8 Log). |
| 87. | Select OK. |
| 88. | Place the cursor over the token defining the denominator 'Statistic: Y Median for Plot #11, overlay #1, Additional Gate: Lymphs'. |
| 89. | Double-click to bring up the Edit Statistic dialog, Data Source category, similar to the Create Statistic dialog previously shown in Figure T17.9. |
| 90. | Select the Color Dot - 1.25ul CD64.fcs.DNS (SS Lin vs. FL 8 Log). |
| 91. | Select OK. |
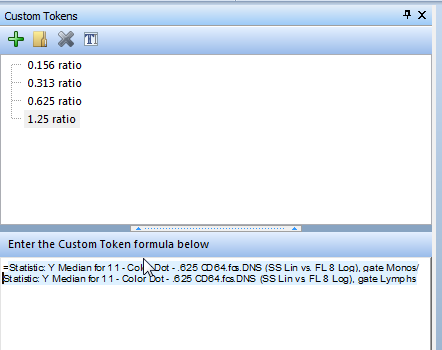
Figure T17.18 Editing Custom Token 1.25 Ratio
Continue to define the Custom Token ratios for the 2.5μl, 5μl, and 10μl CD64 plots using the previous copy and paste instructions. Repeat instructions 75 through 92 substituting 2.5μl for the 1.25μl data, and then the 5μl and 10μl data, until all the Custom Tokens have been defined. The final Custom Token window should look similar to Figure T17.19.
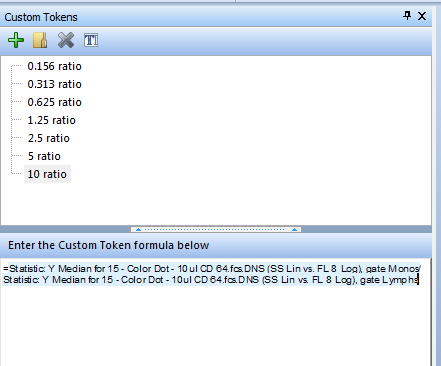
Figure T17.19 Final Custom Token Definitions
In the next section, we will create a custom data table.
