Specific Options
The Specific Options category contains properties to control the way data is displayed on 2D plots.
You can edit 2D plot specific options in one of two ways:
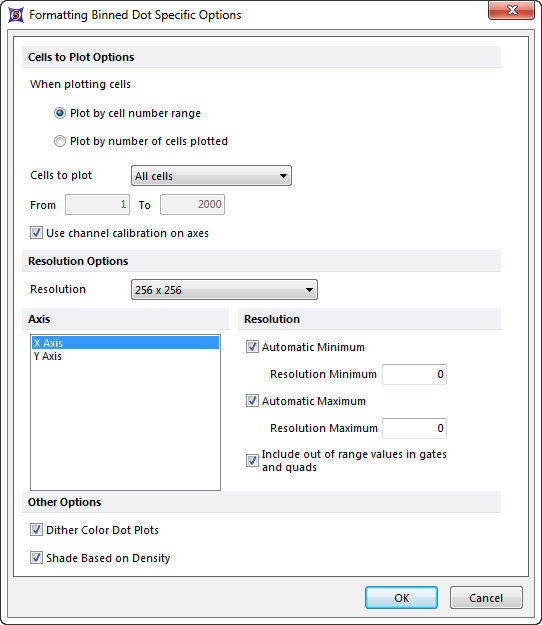
| • | Select the 2D plot and use the Format→Plot Options→Specific Options command. This will bring up the Formatting Binned Dot Specific Options dialog for Dot and Color Dot plots (Figure 8.81), or the Formatting Binned Plot Specific Options dialog (Figure 8.82). |
| • | Right-click on the 2D plot, select Format from the pop-up menu, click on the triangle next to the specific plot type, and choose the appropriate Binned [Dot or Plot] Specific Options category. |

Figure 8.78 Formatting Binned Dot Specific Options Dialog
The options are described in the table below. See Resolution Overview for a further description of resolution options.
Option |
Explanation |
|---|---|
Control how many cells are plotted. If fewer cells are plotted, the plot can draw itself faster. Typically, most of the structure of a plot can be seen if 5000 cells are plotted. With the radio buttons, choose the cell number range or number of cells plotted option. Then, select a value from the drop-down list or enter in freetext into the from and to boxes, as appropriate. Statistics are always calculated based upon all of the cells in the data set, irrespective of how many are plotted. |
|
Use channel calibration on axes |
FCS Express can establish calibrated values for the axes. If channel calibrations are defined, toggling this checkbox will determine whether or not to use the calibrated values in place of the generic channel numbers. |
Resolution options |
Choose a resolution to display the data from the drop-down list. Lowering the resolution effectively smooths the data. |
Resolution overlays |
The resolution options can be changed for the X Axis/Y Axis, or together. To edit the options for one of the axes, select that axis in the list, and change the options. The edit the options for both axes simultaneously, select both axes in the list (Shift-Click). |
Automatic Minimum |
If this is checked, then FCS Express will start binning the data (dividing it into the number of bins specified by the Plot resolution) at either 0 or the lowest data value (if the lowest data value is below 0). |
Resolution Minimum |
Specify where to start binning the data. If Automatic Minimum is checked, then this value is ignored. |
Automatic Maximum |
If this is checked, then FCS Express will finish binning the data (subdividing it into the number of channels specified by the Plot resolution) at the highest value of the true data range. |
Resolution Maximum |
Specify where to finish binning the data. If Automatic Maximum is checked, then this value is ignored. |
Include out of range values in gates and quads |
If this is checked, data values that are outside the resolution options of the plot will be considered to be part of the lower or upper channels. If a gate or quadrant touches the lower or upper channels, it will include these cells, even though the cells are actually outside the boundary of the gate/quadrant. |
Determine which color to use when two dots of different colors overlap each other (if you have more than one overlay or an event is located in an area where two gates overlap). If dither is on, the color will be chosen randomly from one of the two colors. If dither is off, only the most recent color will be used (i.e., if you have two gates defined, the color for gate 2 will always have priority over the color for gate 1, unless gate 1 is dragged below gate 2 in the Gate View.) |
|
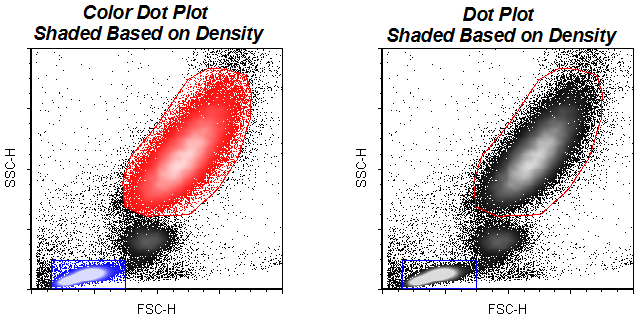
Shade Based on Density (Figure 8.83) |
Creates a greyscale shading pattern based on the density of plotted data. When gates are displayed or when checked on a color dot plot the shading pattern will be pseudo colored to match the color of the gate displayed. |

Figure 8.79 An example of color dot and dot plots shaded based on density.
