Working with Picture Plots
To insert a Picture Plot on your layout, use the Insert tab→2D Plots→Picture Plot command.
To format the plot, right-click on the plot, select Format from the pop-up menu, and choose the Overlays category. Set the Image to display and, if desired, choose an appropriate Gate (e.g., a gate defined on a 1D- or 2D-plot, or a single well gate that you set on the corresponding Heat Map) using the drop-down lists (Figure 28.10). Alternatively, you can select the Picture Plot and use the Format tab→Plot Options→Overlays command.
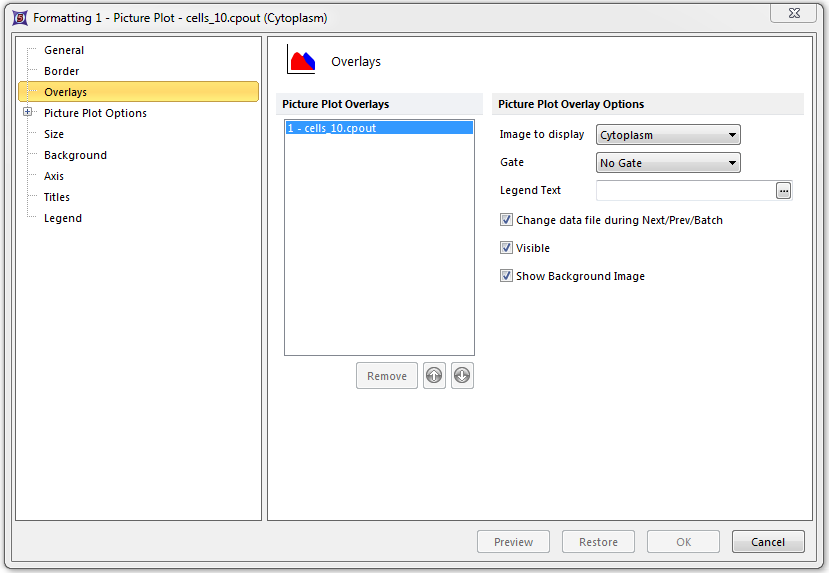
Figure 28.10 Formatting a Picture Plot - Overlays Category
The Picture Plot will display the images of your cells with their location in the field (e.g., a single well that was chosen in a well gate) that was imaged (Figure 28.11). The axes are in pixels with the origin (0,0) located in the upper left corner of the field. You can change the parameter being displayed by clicking on the x-axis label and choosing a new parameter from the pop-up list.
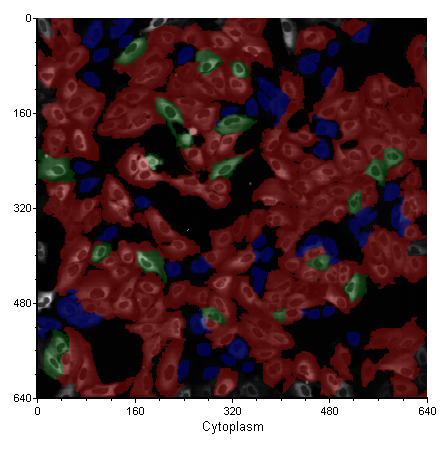
Figure 28.11 A Picture Plot
To display the images from a different well, modify the single well gate by right-clicking on the Heat Map, selecting Edit Gate, choosing the appropriate gate from the submenu, and then selecting a different well. Alternatively, you may create additional Well Gates and apply them to the Picture Plot using any of the methods for applying gates in FCS Express.
Picture Plots can be backgated just like any other color dot plot. In other words, the events (in this case, the images of cells) can be drawn in the color of the gate that they belong to.
To implement backgating:
| 1. | Right-click on the Picture Plot. |
| 2. | Select Format from the pop-up menu. |
| 3. | Expand the Picture Plot Options node. |
| 4. | Choose the Display Gates Options category. |
| 5. | Set the gates to display according to your criteria (Figure 28.12). |
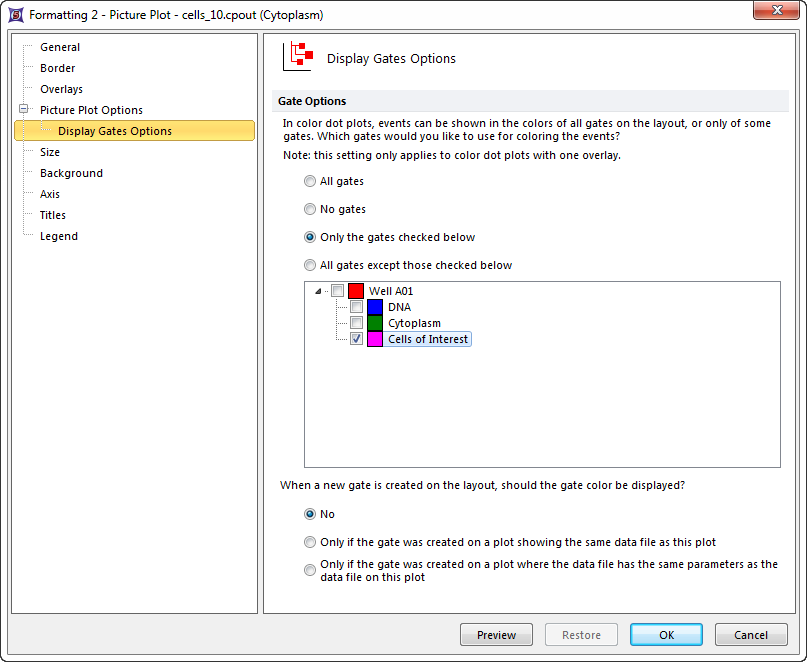
Figure 28.12 Picture Plot - Display Gates Options
In the example, Cells of Interest (pink) has been chosen as the sole backgating color. When you click OK, the objects in Cells of Interest will be colored pink (Figure 28.13).
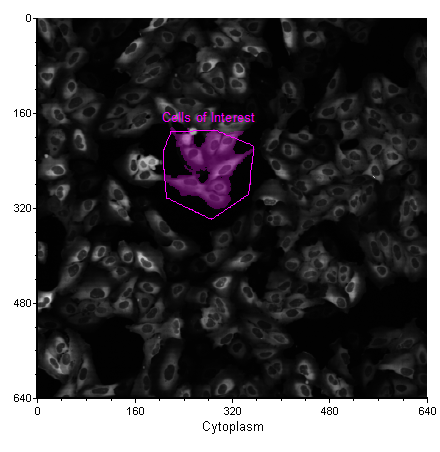
Figure 28.13 Back-Gated Picture Plot. The Cells of Interest display the Pink color of their gate.
You can also gate on a single cell or group of cells on a Picture Plot. Choose a gate shape from the Gating tab→Create Gates group and draw the gate on the plot.
In Figure 28.14, a single cell gate (light blue) has been drawn on the Picture Plot. You can use that gate just like any other gate in FCS Express. For example, you can backgate a Data Grid to show your single cell gate, or you can drag the gate to a Data Grid or other plot to re-gate either one.
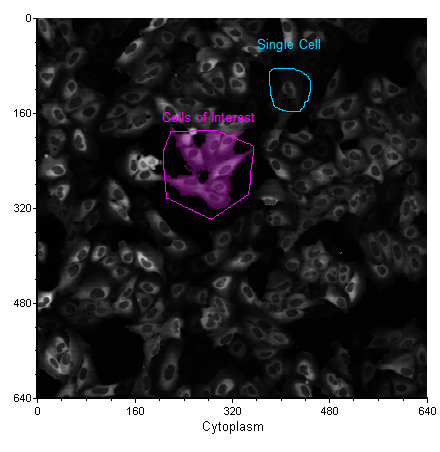
Figure 28.14 Single Cell Gate Drawn on a Picture Plot
