Creating a Custom Token

Contents
Tokens can also be customized to create any kind of statistic that you like. In this example, we will calculate the Apo(+)/Apo(-) ratio in the positive sample file ApoMono.002. This is calculated by taking the # of positive cells and dividing them by the # of negative cells.
To insert a Custom Token:
1.Select File tab→Open.
2.Open the layout TokenCustom.fey found in the Tutorial Sample Data archive.
The layout, shown in Figure T5.43, contains two 2D plots a text box containing the text 'Apo(+)/Apo(-) ratio:'.
We will be inserting a custom token statistic here (Figure T5.43).
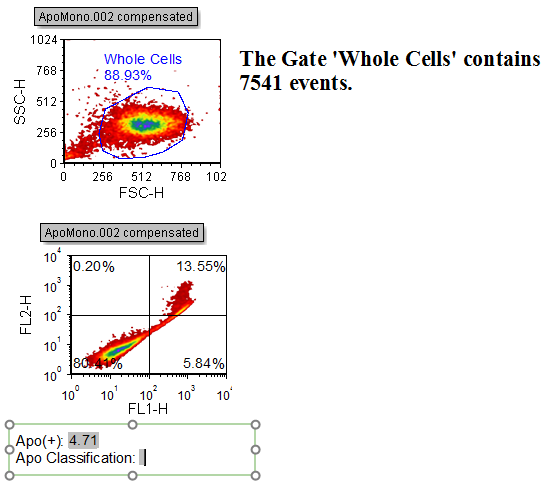
Figure T5.43 Custom Token Layout (TokenCustom.fey)
3.Click in the text box at the end of the incomplete text 'Apo(+)/Apo(-) Ratio:'.
4.Select the View→Tokens→Custom Tokens command (Figure T5.44).
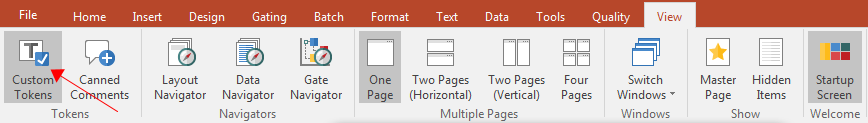
Figure T5.44 Selecting the Custom Tokens Command
The Custom Tokens window should now appear (Figure T5.45).
5.Right-click inside the upper half of the Custom Tokens window and select New Custom Token from the pop-up menu (Figure T5.45).
Alternatively click on the ![]() button within the Custom Tokens window.
button within the Custom Tokens window.

Figure T5.45 Creating a New Custom Token
7.Type "Apo(+)/Apo(-) Ratio: " into the Name field of the New Custom Token (Figure T5.46).
8.Press Enter to accept the new name.
9.The Custom Token "Apo(+)/Apo(-) Ratio:" should now be highlighted (Figure T5.46).

Figure T5.46 Custom Tokens Editor
To calculate the ratio for this example, we will take the number of events in the positive population (upper right quadrant) and divide it by the number of events in the negative population (lower quadrants).
9.Left-click in the lower half of the Custom Tokens window and enter an equals sign "=" (Figure T5.47).
10. Right-click just after the "=" sign to bring up the associated pop-up menu.
11. Select Insert Token from the pop-up menu (Figure T5.47).
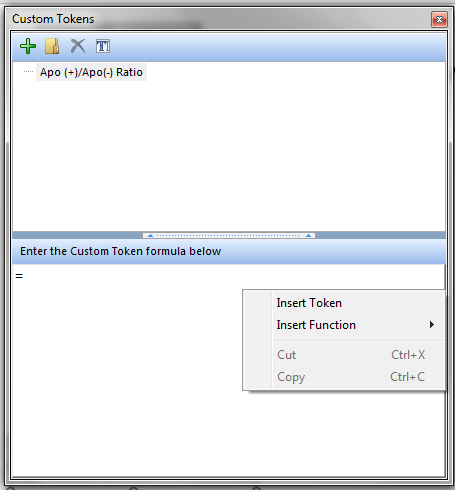
Figure T5.47 Entering a Custom Token Formula
An Insert a Token dialog will appear as in Figure T5.24.
12. Click on Statistic.
13. Click on Insert.
A Create Statistic dialog will appear with the Data Source Category open as in Figure T5.36.
14. Select 2D plot - ApoMono.002 (FL1 vs. FL2) as the data source.
15. Click now on the Statistic Category (on the left).
The Statistic Category of the Create Statistic Window will appear as in Figure T5.37. We will now select the statistic that will define the numerator of our custom token.
14. Select Upper Right in the Select a quadrant drop-down list (Figure T5.37 ![]() ).
).
15. Select Whole Cells in the Gate: drop-down list (Figure T5.37 ![]() ).
).
16.Select % of Gated Cells from the Statistic: list box (Figure T5.37 ![]() ).
).
17. Press OK.
The Custom Tokens Editor (Figure T5.48), will show the statistic in the formula field highlighted in light blue. This is the numerator for our custom token. We will now define the operator and the denominator of our custom token.
20. Enter the division symbol "/" just after the statistic we created in the last steps (Figure T5.48).
21. Right-click after the "/" symbol to bring up the pop-up menu.
22. Select Insert Token from the pop-up menu (Figure T5.48).
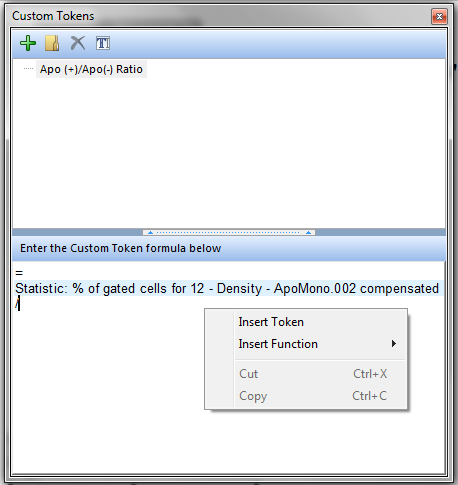
Figure T5.48 Numerator Definition for Custom Token
An Insert a Token dialog box will appear (Figure T5.24).
23. Click Statistic
24. Click Insert
A Create Statistic window will appear with the Data Source Category open (Figure T5.36). We will now define the denominator of our custom statistic token.
25. Select 2D plot - ApoMono.002 (FL1 vs. FL2) as the data source (Figure T5.36).
26. Click on the Statistic Category (Figure T5.37 ![]() ).
).
The Statistic Category of the Create Statistic Window will appear as in Figure T5.37. We will now select the statistic that will define the denominator of our custom token.
27. Select Lower in the Select a quadrant drop-down list (Figure T5.37 ![]() ).
).
28. Select % of Gated Cells from the Statistic: list box (Figure T5.37 ![]() ).
).
29. Select Whole Cells in the Gate: drop-down list (Figure T5.37 ![]() ).
).
30. Press OK.
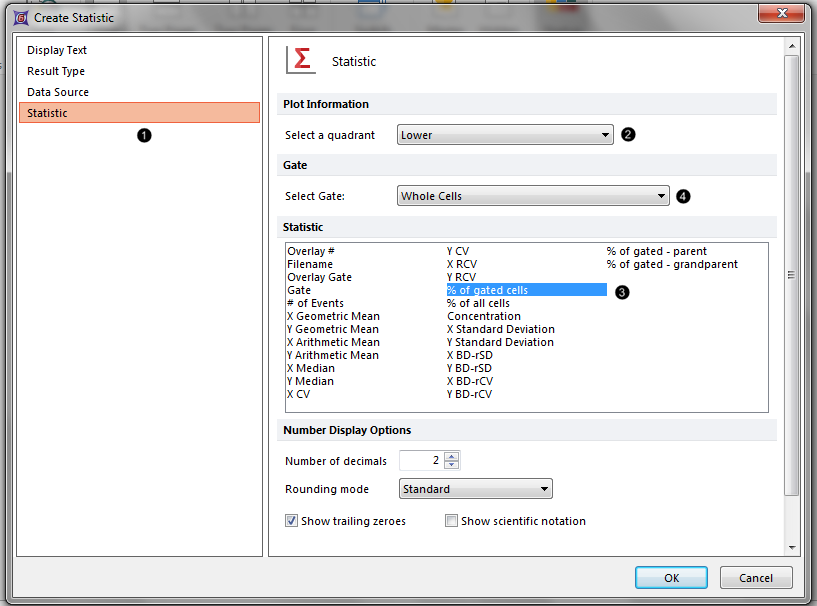
Figure T5.49 Defining the Denominator for the Custom Token
30. Press OK.
The Custom Tokens window (Figure T5.50) will show the upper right quadrant statistic divided by the lower quadrants statistics in the formula field. The tokens are highlighted in blue to indicate that they are being treated as numbers, as opposed to text.

Figure T5.50 Final Custom Token Formula
Now that we have created the custom token, we must insert it into the text box.
31. Position the cursor to the end of the text "Apo(+)/Apo(-) Ratio:" within the text box (Figure T5.51).
32. Select Text→Insert Text→Insert Token from the ribbon (Figure T5.51).
Alternatively, right-click after the "Apo(+)/Apo(-) Ratio: " text to bring up the pop-up menu and select insert token).
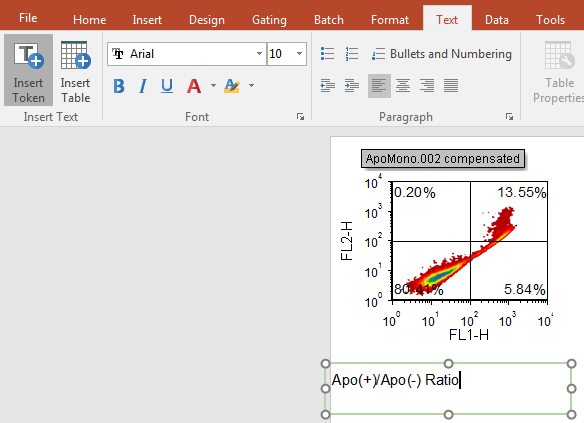
Figure T5.51 Insert Token Command
The Insert a Token dialog will appear with the new custom token Apo(+)/Apo(-) Ratio: listed (Figure T5.52).
33. Click Custom→Apo(+)/Apo(-) Ratio: as the token to be inserted.
34. Click Insert to insert the token into the text box.
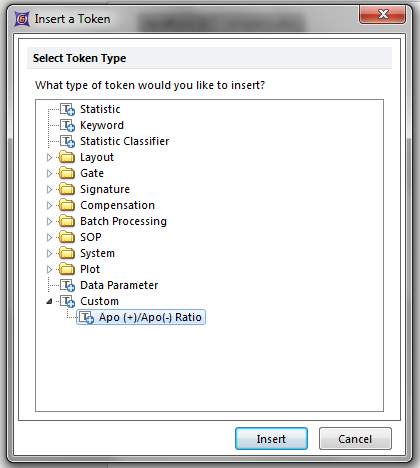
3.Figure T5.52 Selecting the Custom Token
The Apo(+)/Apo(-) Ratio: value of '3.89' will appear highlighted in grey in the text box (Figure T5.53).
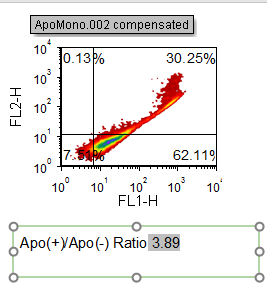
Figure T5.52 Displaying the Custom Token in the Text Box
We will now delete the Custom Token and then insert it by dragging it from the Custom Tokens window.
35. Select the custom token we just insert after the "Apo(+)/Apo(-) Ratio:" text (you can easily recognize it since it is grey highlighted) (Figure T5.53).
36. Press the Delete on you keyboard to remove the custom token.
The Custom Tokens window should still be on the layout as shown in Figure T5.54.
37. Press and hold the left mouse button down on the Apo(+)/Apo(-) Ratio custom token ![]() highlighted in blue in the Custom Tokens window (Figure T5.54).
highlighted in blue in the Custom Tokens window (Figure T5.54).
38. Drag the mouse, while holding the left mouse button down, to the spot after the Apo(+)/Apo(-) Ratio: text ![]() in the text box on the layout page.
in the text box on the layout page.
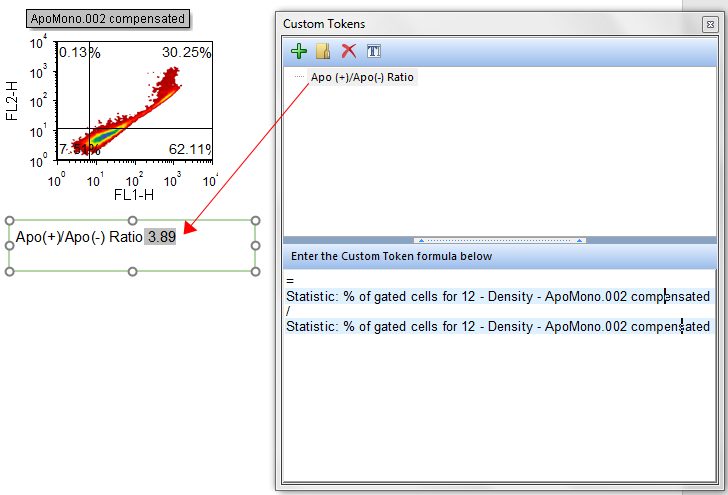
Figure T5.54 Dragging Custom Token onto Text Box
39. Release the mouse button to drop the custom token into the text box.
The custom token is now reinserted in the text box as shown in Figure T5.53.