Plot Tokens
Plot Tokens allow you to insert information pertaining to a plot selected as Data Source. To insert a Plot token:
1. Right-click on a Text Box.
2. Select Insert Token from the pop-up menu.
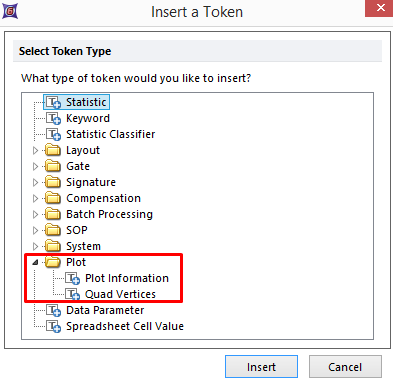
3. Click on the triangle next to Plot (Figure 19.26).

Figure 19.26 - Selecting Plot Token from the Select Token Type dialog
4.Double-click on Plot Information or Quad Vertices.
5.Choose the desired plot from the Select a Plot list from the Data Source category of the Edit Plot Information Token dialog
6.Choose the desired token from the list in the Plot Elements or Quad Vertices category, and click OK.
The available Plot Elements tokens are described below.
Plot Element |
Definition |
Title |
The text within the plot title. |
Footer |
The text contained with the plot footer. |
X Axis Label |
The label used for the X axis within the plot. |
Y Axis Label |
The label used for the Y axis within the plot. |
Plot Number |
The number given to the plot by FCS Express as it is created. |
Plot Description |
An overall description of the plot, showing the Plot Number, Plot Type, the data file name being displayed within the plot, and the X and Y axis parameters for the selected plot. |
Use Channel Calibration? |
Has the Use Channel Calibration on Axes option been selected for that plot? The output is Off or On. |
Is Channel Calibration Applied on X axis? |
A description of whether or not channel calibration has been applied to the X axis. |
Is Channel Calibration Applied on Y axis? |
A description of whether or not channel calibration has been applied to the Y axis. |
This token will display the X- and Y- coordinates for a selected vertex of a Quadrant.
The options are Center, Top, Right, Bottom, Left.
