Inserting from the Data Tab with the Open Command

Contents
To insert a plot:
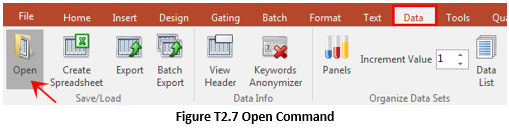
1.Select the Data→Save/Load→Open command (Figure T2.7).
A Select a Data File dialog will open as previously shown in Figure T2.2.
2.Select the GFPcontrol.001 data file from the FCS Express Sample Data directory.
3.Select Open.
A Select Plot Types... dialog will appear (Figure T2.8).

Figure T2.8 Select Plot Types... Dialog
4.Select Dot as the Plot Type to open.
5.Select OK.
A 2D dot plot will now appear on the layout (with a red border to indicate it is in selected mode) as previously shown in Figure T2.3.
You can force the display of the selection dialog using by setting a user preference.