Scatter and Scatter with Regression Plot Overlays
For a full description of working with Scatter Plot specific features such as Error Bars and Highlight parameters please see the Formatting Scatter Plots topic and Scatter Plots Overview topic.
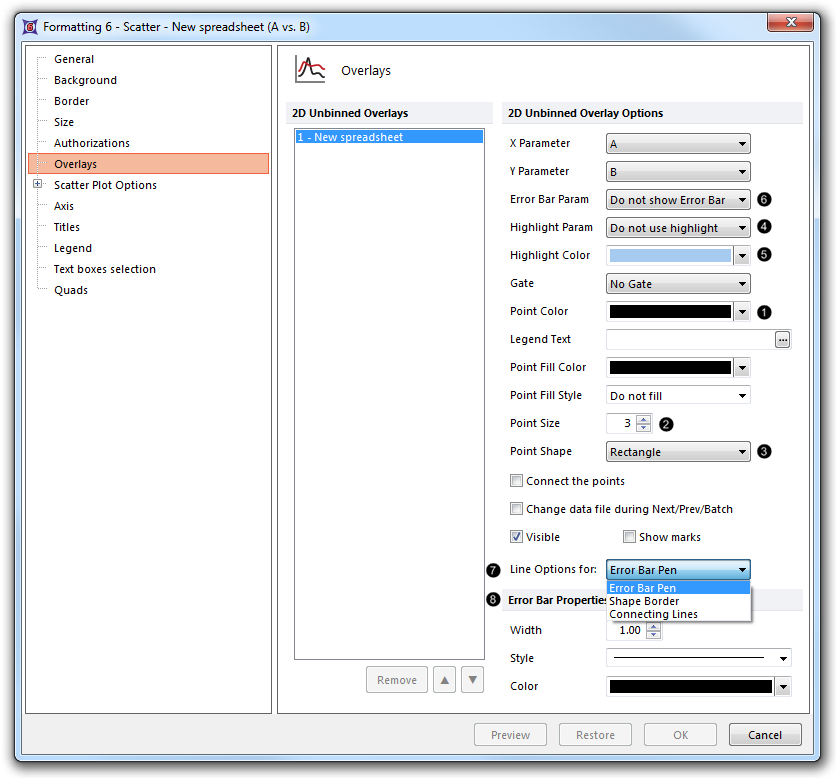
Special overlay formatting options for Scatter and Scatter with Regression Plots are indicated by number and referenced in the table and image below (Figure 8.96).
•Point Color (![]() )
)
•Point size (![]() )
)
•Point shape (![]() )
)
•Highlight Param(![]() )
)
•Highlight Color(![]() )
)
•Error Bar Param (![]() )
)
The formatting options are described in the table below.
Option |
Explanation |
|---|---|
X Parameter |
The parameter (column) from the Spreadsheet displayed on the X axis. |
Y Parameter |
The parameter (column) from the Spreadsheet displayed on the Y axis. |
Error Bar Param. |
The parameter (column) from the Spreadsheet displayed as error bars. See below for more information on how to define the error bars. |
Highlight Param. |
The parameter (column) from the Spreadsheet from which the highlighting rule derives. Points will be highlighted (e.g., the orange point in the plot below) in the color defined in |
Highlight Color |
The display color for highlighted points. |
Gate |
The gate that is applied to the Scatter Plot. |
Point Color |
The display color for points. |
Legend Text |
The text that will appear in the legend beside the symbol for the overlay. Free text can be inserted. If this field is blank the file name of the overlay will appear. |
Point size |
The size of the points. |
Point shape |
The shape of the points. Choose between rectangle (default), triangle, circle, cross, star, hexagon, and diamond options. |
Connect the points |
Whether the points are connected by a line. |
Change data file during Next/Prev/Batch |
Whether the Scatter Plot changes during batch processing or in response to a Next/Previous command. It is generally recommended to leave this unchecked (default), as the Scatter Plot will update automatically as the data to which it refers is changed. |
Visible |
Hides overlays without removing them. Select the overlay file from the 2D Unbinned Overlays list and uncheck Visible. Check Visible to show the overlay again. |
Show marks |
Displays the value of the points as text directly above the points. |
Line Options for |
Toggle between Error Bar Pen, Shape Border, and Connecting Lines editing mode. |
Error Bar Pen/Shape Border/Connecting Lines Properties |
Width, Style (solid, dotted, and dashed options), and Color of the Error Bar Pen, Shape Border, or Connecting Lines. |

Figure 8.96 Special formatting options for Scatter and Scatter with Regression Plots
