Working with tSNE transformations
Once a tSNE transformation is applied to a plot, tSNE parameters can be accessed by clicking on the axis label of the plot Figure 29.69. Gates may be created on any combination of standard or tSNE parameters on any plot type to specifically select the events within one or more tSNE clusters. Jump to Gating tSNE transformed data.
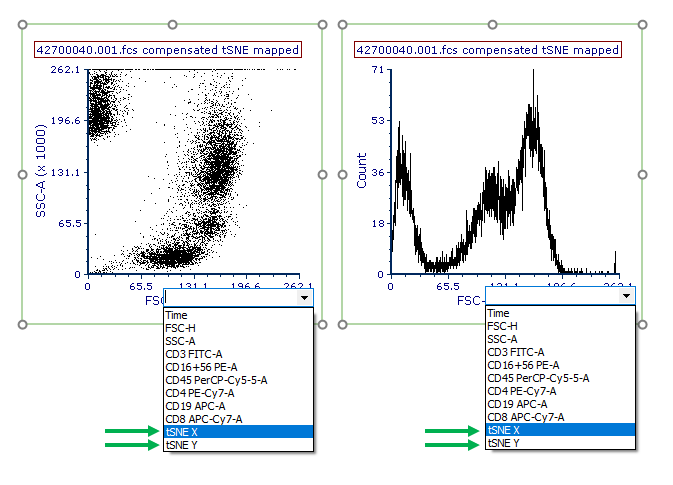
Figure 29.69 tSNE parameters can be accesses as standard parameters.
While any plot type can display tSNE based parameters, Density plots and Contour plots have a unique overlay option called Color Based on (Figure 29.70) that is helpful for visualizing and understanding tSNE transformed data sets.
The Color Based on option is access via either:
•The Formatting→Overlays category of Density and Contour plots. The Color Based on dropdown menu will allow you to choose from Count or any available parameter for the data set to display as the Density or Contour map on the plot.
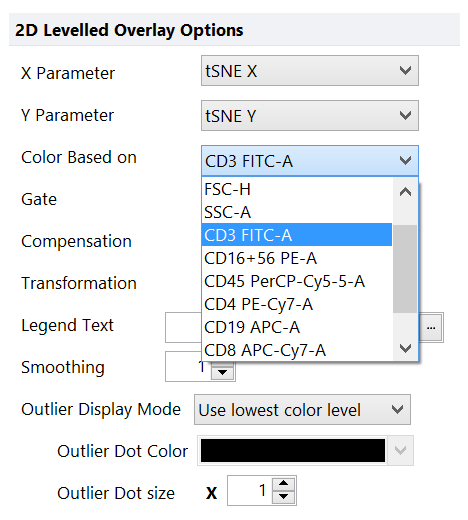
Figure 29.70 - The Color based on option in the formatting>overlays category of density and contour plots allows you to choose a parameter that will be used to display a density or contour map on tSNE X and tSNE Y transformed parameters.
•The Legend title, when the plot legend is visible (see the red arrow in the pictures below).
For tSNE transformed data sets it is useful to display tSNE X and tSNE Y parameters on their respective X Parameter and Y Parameter axis and visualize each additional target parameter as a Color Based on selection. In the examples below the same tSNE transformation for an analysis is shown in three different display types with each plot using the Color Based on parameter indicated in the upper left of the plot. The top example shows Density plots with the Flame Color Level, the middle example shows Contour plots with outliers enabled, while the bottom plot shows Density plots withe Green-Black-Red Color Level with a Style of Mean +/- SD and Standard Deviations set to 2.00.
Note that there are a number of options in FCS Express that may be changed to display tSNE transformed data in unique ways and seemingly unlimited combinations. The following list of formatting options may be useful for reviewing and preparing data visualizations:
Please note that reducing Smoothing to 0 or 1 on plot overlays or reducing the resolution may significantly enhance your plot visualizations.
•Overlays - To choose the Color Based on parameter and to show or hide outliers and outlier coloring.
•Color Levels - To choose the overall color scheme and color level properties for Density and Contour Plots.
•Specific Options - To choose the resolution to display plots at and the select Shade Based on Density if desired.
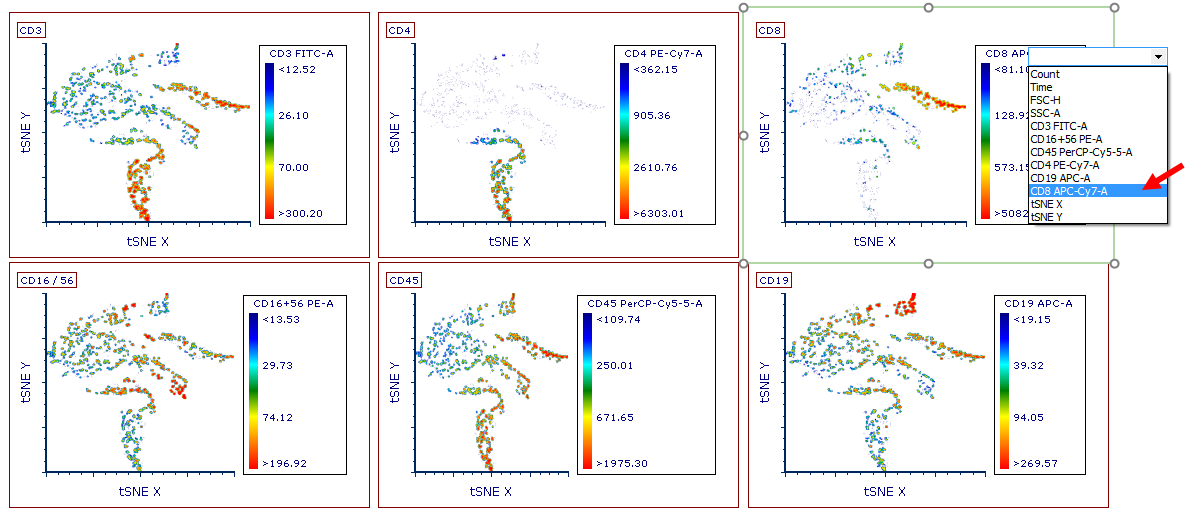
Color Based on parameter indicated in the upper left of the plot. Example above shows Density plots with the Flame Color Level.
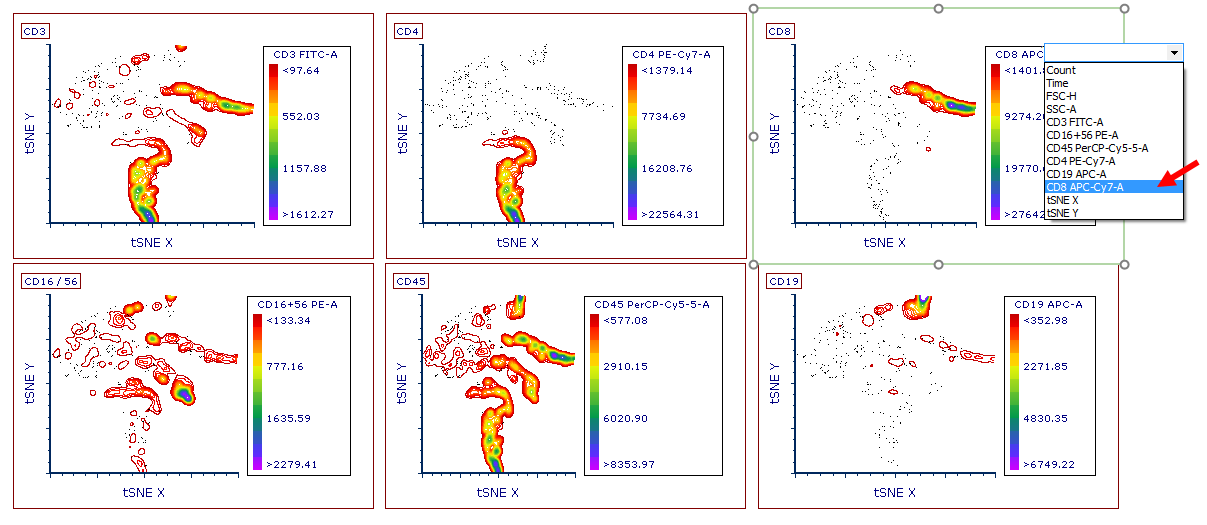
Color Based on parameter indicated in the upper left of the plot. Example above shows Contour plots with outliers enabled.
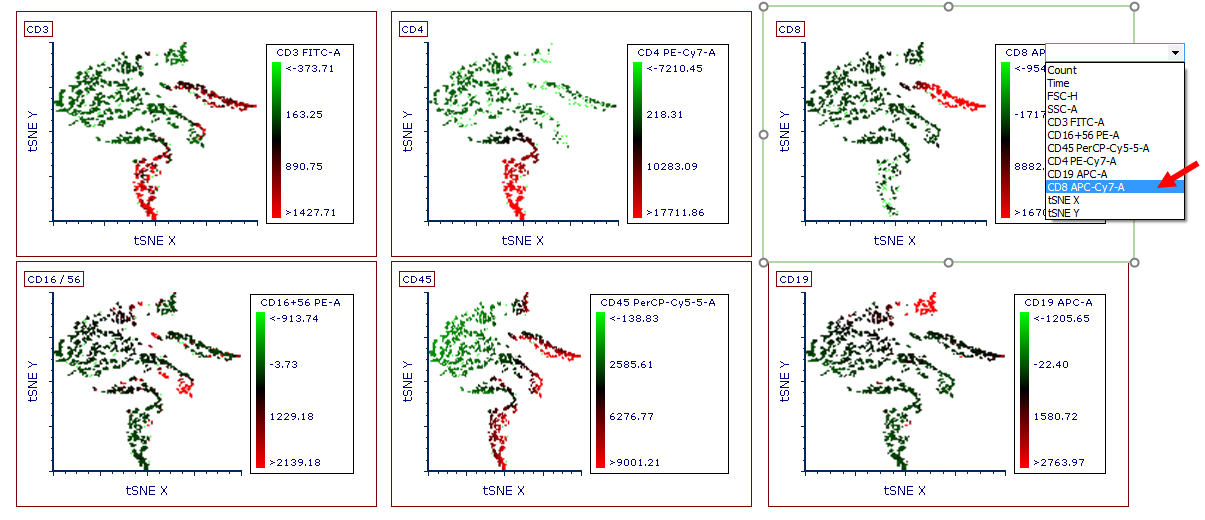
Color Based on parameter indicated in the upper left of the plot. Example above shows Density plots with Green-Black-Red Color Level with a Style of Mean +/- SD and Standard Deviations set to 2.00.
Gates may be created on any combination of standard or tSNE parameters on any plot type to specifically select the events within one or more tSNE clusters. Gated populations may also be used to gate or back gate events on any tSNE transformed plot.
An example of gates drawn, backgated, and gated on tSNE parameters is shown in the Figure below (Figure 29.71).
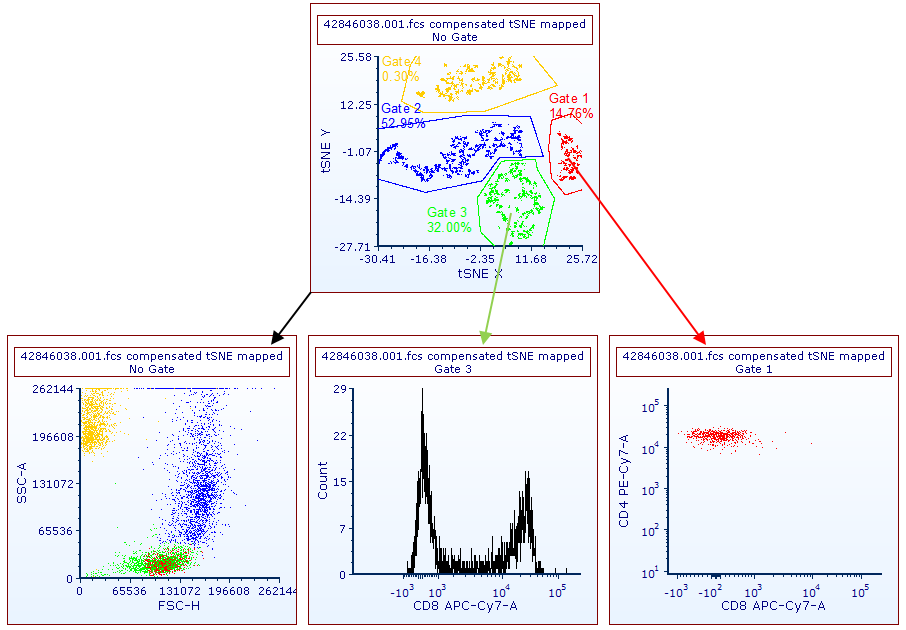
Figure 29.71. Gates have been drawn on tSNE parameters (upper panel) and have been displayed (lower left plot) or applied (lower central and lower right plots) to other plots.
