Creating a 1D Gate on a 2D Plot

Contents
1D gates can be applied to 2D plots as well as single parameter histograms (where they are called Markers). 1D gates are unique in the respect that they only gate on data in a single dimension. We will continue using the same layout we were using above in the previous section.
We will now create a 1D gate on the 2D plot underneath where it says "Create the elliptical gate on this plot" (Figure T4.6b).
To create a 1D Gate on a 2D plot:
1.Select the Gating tab→Create Gates→Create Marker command, or right-click on the plot and select Create gate→ Marker from the pop-up menu.
You will know the Create Marker command is selected because it will have a different color background  .
.
2.Place the cursor on the 2D plot at the location you want to start the gate.
3.Press and hold down the left mouse button.
4.While holding the mouse button down, move the cursor from the left to the right to create a 1D gate in the horizontal direction.
Note: Moving the cursor from the right to left, or left to right, will create a 1D gate along the x-axis. Moving the cursor in the vertical direction, either up or down, will create a 1D gate along the y-axis. In this example, we will create a gate along the x-axis.
5.Release the mouse button when at the desired location (Figure T4.9).
Create the elliptical gate on this plot.
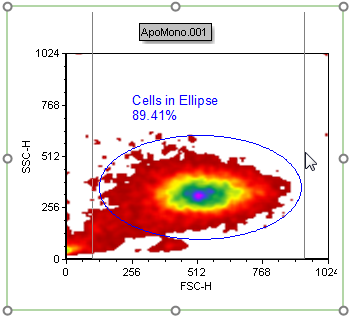
Figure T4.9 Creating a 1D Gate on a 2D Plot
A Create a new gate dialog will appear, as previously shown.
6.Enter "Cells in marker" in the Create a new gate named edit field.
7.Press OK to accept the name.
8.
A 1D gate now appears on the 2D plot (Figure T4.10).

Figure T4.10 1D Gate on a 2D Plot
Next, we will create a gate from a marker.