Creating Gates

Contents
In the course of this example, we will:
•Open a previously created layout.
•Create rectangular, elliptical, polygonal, and freeform gates.
•Change a data file.
•Create a 1D gate on a 2D plot.
•Create a 1D gate from a marker.
•Convert a quadrant to a gate.
Although any data files of your own can be used to follow along in this tutorial, you have the option of using the same sample data files used in this tutorial. The sample data files are located in the Tutorial Sample Data archive. The section5.fey layout and the ApoMono.001 and ApoMono.002 data files will be used here.
To Open a Layout:
1.Select File tab→Open (Figure T3.1).
2.Select the section5.fey layout file located in the Tutorial Sample Data archive from the Load Layout dialog.
3.Select the Data→Change Data on All Objects→Select command to insert a data file into the plot (Figure T3.4).
4. Select the ApoMono.001 FCS file located in the Tutorial Sample Data archive.
5. Click Open.
The layout should now look like Figure T4.0.

Figure T4.0 Section5 layout after file loading
We are going to insert four different kinds of gates on the different plots on the layout.
Using the commands from the Create Gates groups on the Gating tab (Figure T4.1) is the most convenient way to create gates, but all gates except markers (1D) can also be created using Create Gate from the 2D plot pop-up menu (right-clicking on a plot brings up the pop-up menu). The Gating commands are shown in Figure T4.1 and described in the table below.
Note: Gating of data obtained from multiwell plates will be discussed in a subsequent tutorial (see Analyzing Data in Heat Maps section).
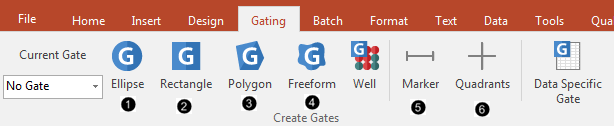
Figure T4.1 Gating Commands
Symbol |
Description |
|
Insert an elliptical gate |
|
Insert a rectangular gate |
|
Insert a polygonal gate |
|
Insert a freeform gate |
|
Insert a marker |
|
Insert a quadrant |
If you hover your mouse briefly over any of the commands in the Create Gates group, a hint describing the command is shown.
To see the gating command hint (Figure T4.2):
5.Move the mouse over the Rectangle gate button.
6.Pause for half of a second.
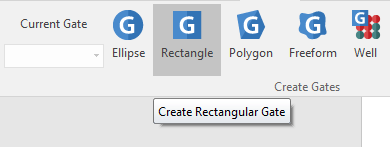
Figure T4.2 Gating Command Hint
To create a Rectangular Gate:
7.Select the Gating→Create Gates→Rectangle command (Figure T4.1 ![]() ).
).
You will know it is pressed because it will have a different color background .
.
We will create the rectangular gate on the upper left density plot (referred to as "Create the rectangular gate on this plot") (Figure T4.3) .

Figure T4.3 Density Plot for First Gating Excercise
8. Move the cursor on the plot wherever you would like the gate to begin.
9. Press and hold the left mouse button.
10. Move the cursor on the plot wherever you would like the gate to stop. (Figure T4.4).
11. Release the mouse button.
Create the rectangular gate on this plot.
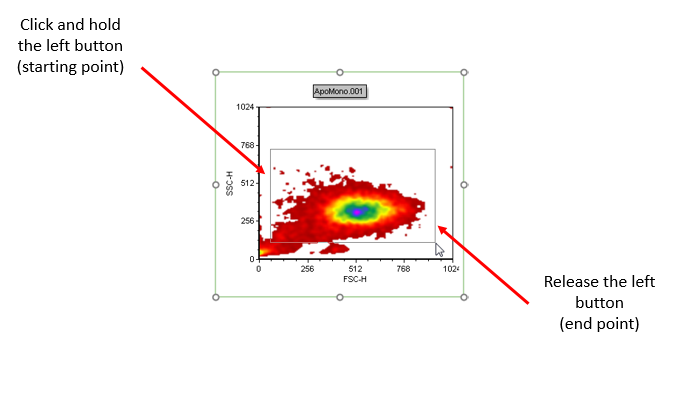
Figure T4.4 Creating a Rectangular Gate
The Create New Gate dialog will appear (Figure T4.5). We can now give the gate a name.
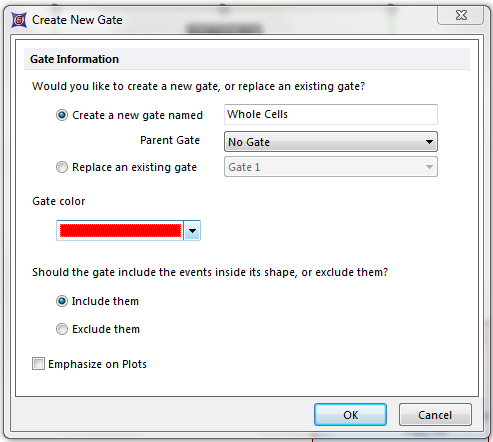
Figure T4.5 Create New Gate Dialog
12. Enter "Whole Cells" in the Create a new gate named edit field.
13. Click OK to accept the name.
The gate and a text box displaying the gate name and the % of gated cells will appear in the plot (Figure T4.6).

Figure T4.6 Newly Created Rectangular Gate
Note: You can cancel the creation of gates anytime during step 7-12 by pressing ESC on the keyboard. This technique applies to all types of gates.
To create an Elliptical Gate:
14.Select the Gating→Create Gates→Ellipse command (Figure T4.1 ![]() ).
).
You will know it is pressed because it will have a different color background  .
.
We will create the elliptical gate on the upper right density plot (referred to as "Create the elliptical gate on this plot").
15.Follow steps 8-11 above to create the elliptical gate.
16. Enter "Cells in ellipse" in the Create a new gate named edit field.
17. Press OK to accept the name.
The gate and a text box displaying the gate name and the % of gated cells will appear in the plot (Figure T4.6b).

Figure T4.6b Newly Created Elliptical Gate
To create a Polygon Gate:
We will create the polygon gate on the lower left density plot (referred to as "Create the polygon gate on this plot").
18. Select the Gating→Create Gates→Polygon command (Figure T4.1 ![]() ).
).
You will know it is pressed because it will have a different color background  .
.
19. Move the cursor on the plot wherever you would like the add the first point of your polygon gate.
20. Press the left mouse button. The first point of your gate is created
21. Move the cursor on the plot wherever you would like the add the second point of your polygon gate.
22. Press the left mouse button. The second point of your gate is created
23. Repeat steps 19-22 until you want to close the polygon.
24. Close the polygon gate by clicking on the first point created in step 20. Alternatively, you can press the space bar to close the polygon.
A Create New Gate dialog will appear, similar to Figure T4.5. We can now give the gate a name:
25. Enter "Cells in a polygon" in the Create a new gate named edit field.
26. Click OK to accept the name.
The gate and a text box displaying the gate name and the % of gated cells will appear in the plot (Figure T4.7).

Figure T4.7 Polygon Gate
To create a Freeform Gate:
We will create the freeform gate on the lower right density plot (referred to as "Create the freeform gate on this plot").
27. Select the Gating→Create Gates→Freeform command (Figure T4.1 ![]() ).
).
You will know it is pressed because it will have a different color background  .
.
28. Move the cursor to the place where you want to start the gate.
29. Press and hold down the left mouse button.
30. Move the cursor while holding the mouse button down to create the shape of the gate. A line will follow the cursor showing where the gate will appear.
31.Release the mouse to finish creating the gate (Figure T4.8).
A Create New Gate dialog will appear, again similar to Figure T4.5. We can now give the gate a name:
32. Enter "Cells in freeform" in the Create a new gate named edit field.
33. Click OK to accept the name.
The gate and a text box displaying the gate name and the % of gated cells will appear in the plot (Figure T4.6b).

Figure T4.8 Freeform Gate
In the next section, we will create a 1D gate on a 2D plot.