Formatting Multiple Plots

Contents
In the course of this example, we will:
•Duplicate a plot using the pop-up menu.
•Use the Format tab from the ribbon to format multiple plots simultaneously.
1.Right-click on the plot to bring up the pop-up menu.
2.Select Duplicate from the pop-up menu (Figure T3.7).
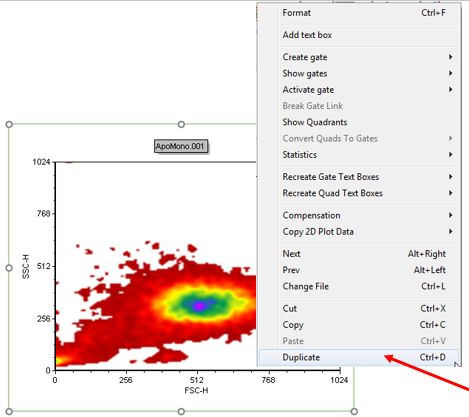
Figure T3.7 Duplicating a Plot
A duplicate copy of the plot should appear on top of the original plot (Figure T3.8).

Figure T3.8 Duplicated Plot
3.Move the mouse over the top border of the duplicate plot, the cursor should change to a four-headed arrow.
4.Hold down the left mouse button while moving the duplicate plot down the page.
5.Release the mouse button when the duplicate plot is at a desired location.
There should now be two identical plots on the page as shown in Figure T3.9.

Figure T3.9 Duplicated Plots on a Layout Page
6.Select both plots on the layout (see the tutorial on selecting multiple objects).
7.Select Format→Object Options→Border/Line (Figure T3.10).
We will format the border/line of both plots at the same time.
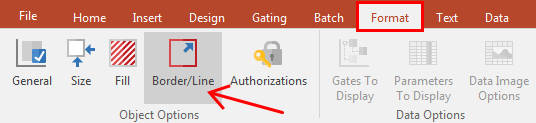
Figure T3.10 Format Border/Line Command
8. Select Line from the Formatting Border/Line dialog.
9. Select a solid line is the Style.
10. Select Blue as the Color (Figure T3.11).
11. Click OK.
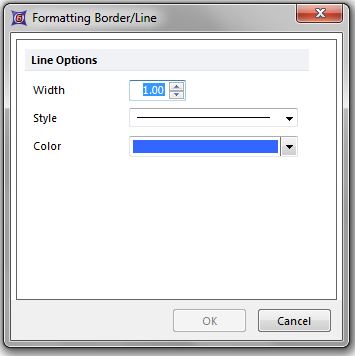
Figure T3.11 Formatting Border/Line Dialog
Both plots will now have a blue border, as shown in Figure T3.12.

Figure T3.12 Plots with a Blue Border
12. Select Undo from the Quick Access Toolbar to undo the formatting changes to the plots (Figure T3.13).
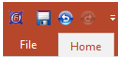
Figure T3.13 Undo
The plots will now be restored to their original formatting with no border.
There are many options available for formatting objects using the Format tab (see Figure T3.14). If you hover your mouse over a command on the Format tab, a brief description of the command’s actions appears, as shown for the Fill command in Figure T3.14.

Figure T3.14 Format Tab
In the next section, we will format plot titles.