Inserting Text Boxes

Contents
There are several ways to insert a text box, but the two most common methods are: inserting a default-sized text box, or a custom-sized text box. You can also add a text box directly into a 2D plot or histogram so that when you move the plot, the text box will also move.
In the course of this example, we will:
•Insert a text box.
•Insert a custom-sized text box.
•Insert a text box into a plot.
To insert a default-sized text box:
1.Select File tab→New→New to create a new layout.
2.Select the Insert→General→Text Box command (Figure T5.1).
3.Click anywhere on the layout to place the text box.
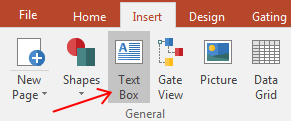
Figure T5.1 Selecting the Insert Text Box Command
By default, a text box of 1 inch by 1 inch will appear where you place and click your left mouse button on the layout. Note: To change this default size setting, select File tab→Options→Text Boxes.
The text box will appear in edit mode (green border) with a blinking mouse cursor (Figure T5.2). This means that you can now enter text into the text box. Entering text is similar to typing in a text box in Microsoft PowerPoint™.
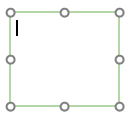
Figure T5.2 Empty Text Box
To insert a custom-sized text box:
1.Select the Insert→General→Text Box command.
2.Place the mouse on the layout where you would like the top left corner of the text box to begin.
3.Press and hold down the left mouse button.
4.Move the mouse while holding down the mouse button. A dashed outline showing the dimensions of the object will appear as you move the mouse (Figure T5.3).
5.Release the mouse button once you have enlarged the dashed outline to the desired size. An empty text box will appear in edit mode (green border) at that position.
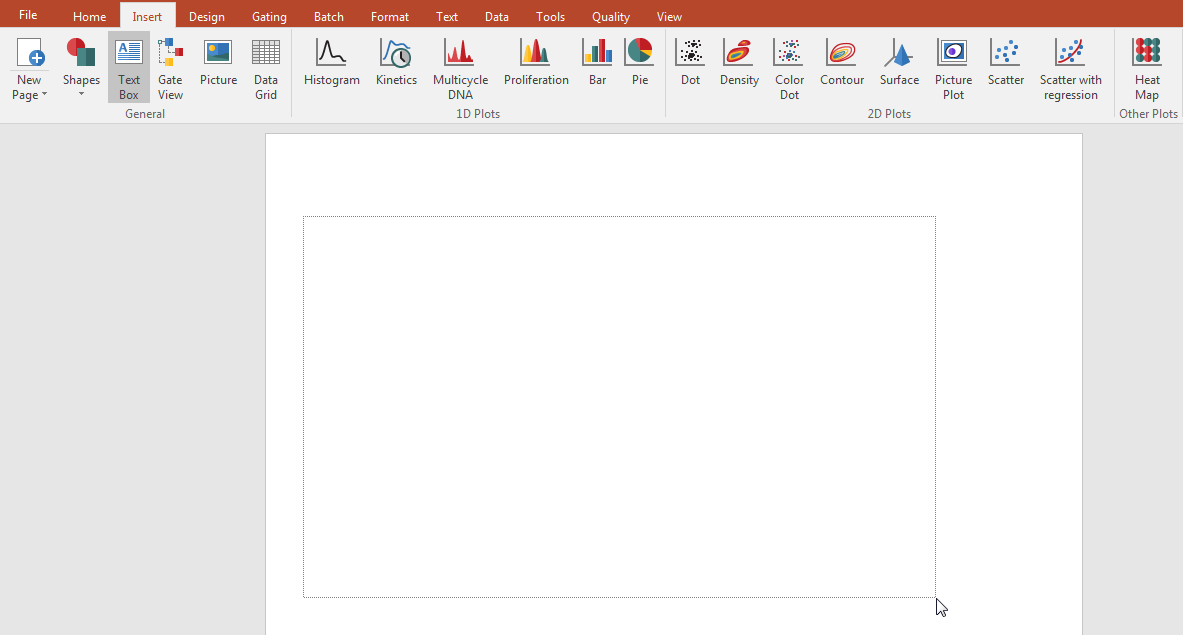
Figure T5.3 Inserting a Custom-sized Text Box
To insert a text box into a 2D plot or histogram:
1.Select File→Close to close the layout we were just working on.
2.Select File→Open.
3.Open the layout TextBoxInsertion.fey found in the FCS Express Sample Data folder.
This layout contains a density plot of APC-A vs. PE-A.
4.Right-click on the plot. A green border will appear indicating that the plot is selected and the pop-up menu will appear.
5.Select Add Text Box (Figure T5.4) from the pop-up menu.
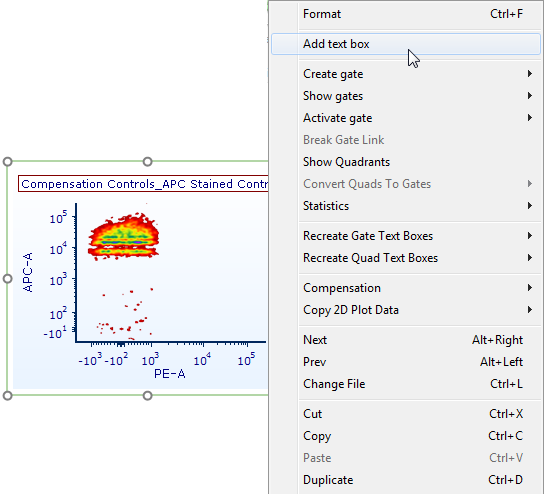
Figure T5.4 Adding a Text Box to a Plot
A small text box will appear in the upper left-hand corner of the plot (Figure T5.5). You can now begin entering text.
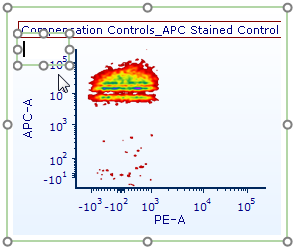
Figure T5.5 Text Box Added to a Plot
The text box is now embedded within the plot. Moving the plot you will also move the text box. You can also move the text box anywhere within the plot. For help with moving objects, please see the tutorial on Using Objects.
6.Select File→Close to close the layout we were just working on.
In the next section, we will format the text in a text box.