Overlays
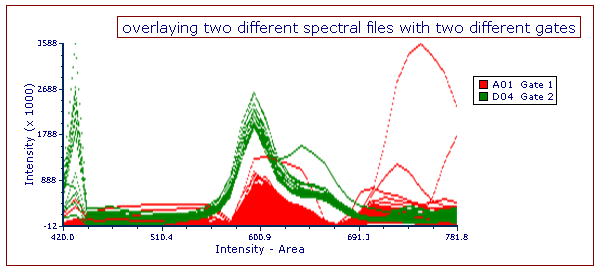
The Overlays option controls the spectrum and appearance of spectrum overlays. All Spectrum Plots have at least one overlay and a spectrum to display. Additional overlays from the same or different spectral datafiles can be added, and different gates can be applied to each, if desired (e.g., Figure 8.90).

Figure 8.90 - Spectral plot with two overlays from different spectral datafiles, each with a different gate applied.
You can add additional overlays by any of the following methods:
•Right-click on the plot and select Add overlay from the pop-up menu (launches a standard browser window called Select Data File), or
•Right-click on the plot and select Add Overlay using Advanced Open Data Dialog (launches the Open Data File dialog), or
•Drag-and-drop file(s) from the Data List onto the plot you wish to overlay.
To edit overlays: right-click on the Spectrum Plot, select Format from the pop-up menu, and choose the Overlays category (Figure 8.91).

Figure 8.91 - Formatting Spectrum Overlays Dialog
In the dialog, a list of all the overlays on the Spectrum Plot will appear in the list box to the left ![]() . You can select one or more overlays using standard Microsoft Windows techniques, including Shift-Click and Cmd-Click. The properties on the right
. You can select one or more overlays using standard Microsoft Windows techniques, including Shift-Click and Cmd-Click. The properties on the right ![]() pertain to the currently selected overlay(s). If multiple overlays are selected, the information will appear blank for those properties that are not identical in all selected overlays. If the properties are not blank, then they are identical for all selected overlays. Changing an option will change that property for all selected overlays. For instance, if you select three overlays and change the Gate, the Gate for all three overlays will be modified.
pertain to the currently selected overlay(s). If multiple overlays are selected, the information will appear blank for those properties that are not identical in all selected overlays. If the properties are not blank, then they are identical for all selected overlays. Changing an option will change that property for all selected overlays. For instance, if you select three overlays and change the Gate, the Gate for all three overlays will be modified.
To remove an overlay from a plot, select the overlay(s) and press the Remove button.
To change the order of selected overlay(s) in the legend, use the blue up and down arrows (![]() ).
).
For a brief tutorial on how to use overlays, visit us at https://youtu.be/nVqwvDo1RmA.
Standard Overlay formatting options are explained in the table below; additional Overlay options specific to Spectrum Plots, which can greatly aid in analysis and report generation, are explained in detail here.
Option |
Explanation |
|---|---|
Spectrum |
Change the laser line displayed on the spectrum plot. |
Gate |
If gates are defined, select the gate that will be used to limit the data that is displayed for each Overlay on the spectrum plot. |
Legend Text |
The text that will appear in the legend beside the symbol for the overlay. Free text can be inserted. If this field is blank the file name of the overlay will appear. A dropdown menu with additional pre-customized legend content is accessible by pressing the ellipsis button next to the legend text. Possible choices are: oKeyword. This can be used to insert keywords from the header of the data file. oGate. This can be used to display the current gate applied to the overlay. oTube Number. This can be used to display the Tube Number of the overlay when a Panel is active. oTube Name. This can be used to display the Tube Name of the overlay when a Panel is active. The above mentioned Legend options apply only to Dot Plots, Color Dot Plots, Histograms and Spectrum Plots. |
Smoothing |
Set the degree of smoothing for the overlay. |
Change data file during Next/Prev/Batch |
If this option is checked, the data file for this overlay will change when doing batch processing, or selecting Previous File or Next File. This option is usually only disabled for a control spectrum, where you have multiple overlays, and want the control to stay the same all of the time. |
Visible |
You can hide overlays on a spectrum plot without removing them. Select the overlay file from the list and uncheck Visible. Check Visible to show the overlay again. |
Line Options |
Choose the overlay line width, style, and/or color. |
