Specific Options
The following default Options can be specified in the Specific Options category for indicated FCS Express User Options plot types:
•Resolution (explained below for Histograms, Kinetics, Dot, Color Dot, Density, Contour, and Surface Plots)
•Normalization, Control Histogram for Subtraction Statistics, and Stacked vs. Overlaid display (Histograms)
•Cells to Plot (Kinetics, Dot, Color Dot, Density, Contour, and Surface Plots)
•Whether Channel Calibration is applied to axes (Histograms, Kinetics, Dot, Color Dot, Density, Contour, and Surface Plots)
•Dither Color Dot Plots (Dot, Color Dot, and Scatter Plots)
•Shade Based on Density (Dot and Color Dot Plots)
•Orientation (Heat Maps)
The resolution options are located in the Formatting dialog in the Histogram→Histogram Specific Options category for histograms, and the Dot Options→Binned Dot (or Plot) Specific Options category for 2D plots. The properties you set are slightly different for the two kinds of plots, but the basic functionality is similar in both.
An important concept to understand is "What is the resolution of a plot?"
The resolution is the number of bins (channels) that parameter data is subdivided into. Before displaying a plot, FCS Express takes the data and compresses it into the number of bins selected by the user. This process is known as binning. The values in these bins are displayed in the plots. When the resolution is lower, the same data gets compressed into fewer bins, meaning that the values in the bins will be higher. That is why the peaks in histograms, contour, and density plots increase when the resolution is lowered. The way FCS Express puts the data into the bins is determined by the scale.
Note: Statistics are always calculated on the full range of data, regardless of how the resolution is set on a particular plot.
In FCS Express, you can set the value of the resolution, and control the range of data (minimum and maximum) that is displayed:
•Value of the resolution
oFor histograms (Figure 8.67), you can choose the range specified in the data you are using, or set the resolution to a specific number chosen from the drop-down list.

Figure 8.67 Histogram Resolution Options
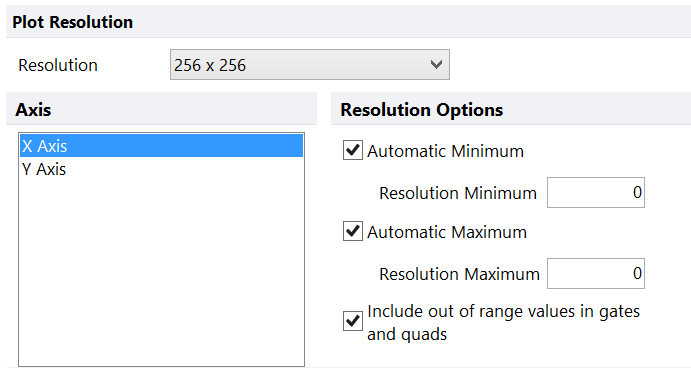
oFor 2D plots (Figure 8.68), choose from the drop-down list (32 x 32 to 1024 x 1024).

Figure 8.68 2D Plot Resolution Options
•Range of Data (Minimum and Maximum)
FCS Express gives you the option of dividing the full range of data into the resolution (number of bins) you specify, or to "cut out" either the top end or the low end of the data. In most cases, it is preferable to leave the resolution maximums and minimums at the default value, i.e., automatic. There are two reasons you might want to set the minimum or maximum. The first is that in certain cases, some instruments may store extreme values in the data. In general, this will just be noise, not significant data. If an extreme data point is included when the plot is calculated, information may be lost in a significant part of the range. In such a case, you can exclude the extreme data point by setting a minimum or maximum value to use for significant data points. The second reason you might want to set the minimum and/or maximum is to provide detailed zooming into a small range of values. You can also decide whether or not to include out of range values in gates and quads.
•Include Out of Range values in gates and quads
If you have not chosen to use an automatic resolution minimum or maximum, there could be data that is outside the visible portion of the plot. You can choose whether or not to include this data in gates or quads drawn on this plot by selecting include out of range values in gates and quads. If this option is checked, and the gate touches an extreme edge of the plot, values outside the range of that edge will be included inside the gate. Values outside the edge of the plot will also be included in the appropriate quad.
Technical note: Axis Resolution and Statistics
In FCS Express 6, all the statistics are calculated on the raw data, irrespective of the display scaling. However, when Gates and Quadrants are created, decisions must be made in cases when an event falls on the line of the gate or quadrant.
In FCS Express 6, Gates and Quadrants are calculated and drawn in a binned space with binning dependent on both the Scaling and the Resolution Minimum/Maximum of the plot. In turn, the inclusion or exclusion of an event on the border line of a gate or in a quadrant is highly dependent on the scaling of the plot, and on the Resolution Minimum/Maximum, of the plot the Gate/Quadrants was drawn on.
When adjustments to the scaling or resolution of a plot are made, an event may then fall to a different side of the border line of the gate/quadrant, and the user may notice very slight changes in the statistics of gated events which are usually quite minimal and make no impact on the interpretation of the results.
Please refer to the Axis Scale and Statistics chapter for more details.
