Working with k-means parameters
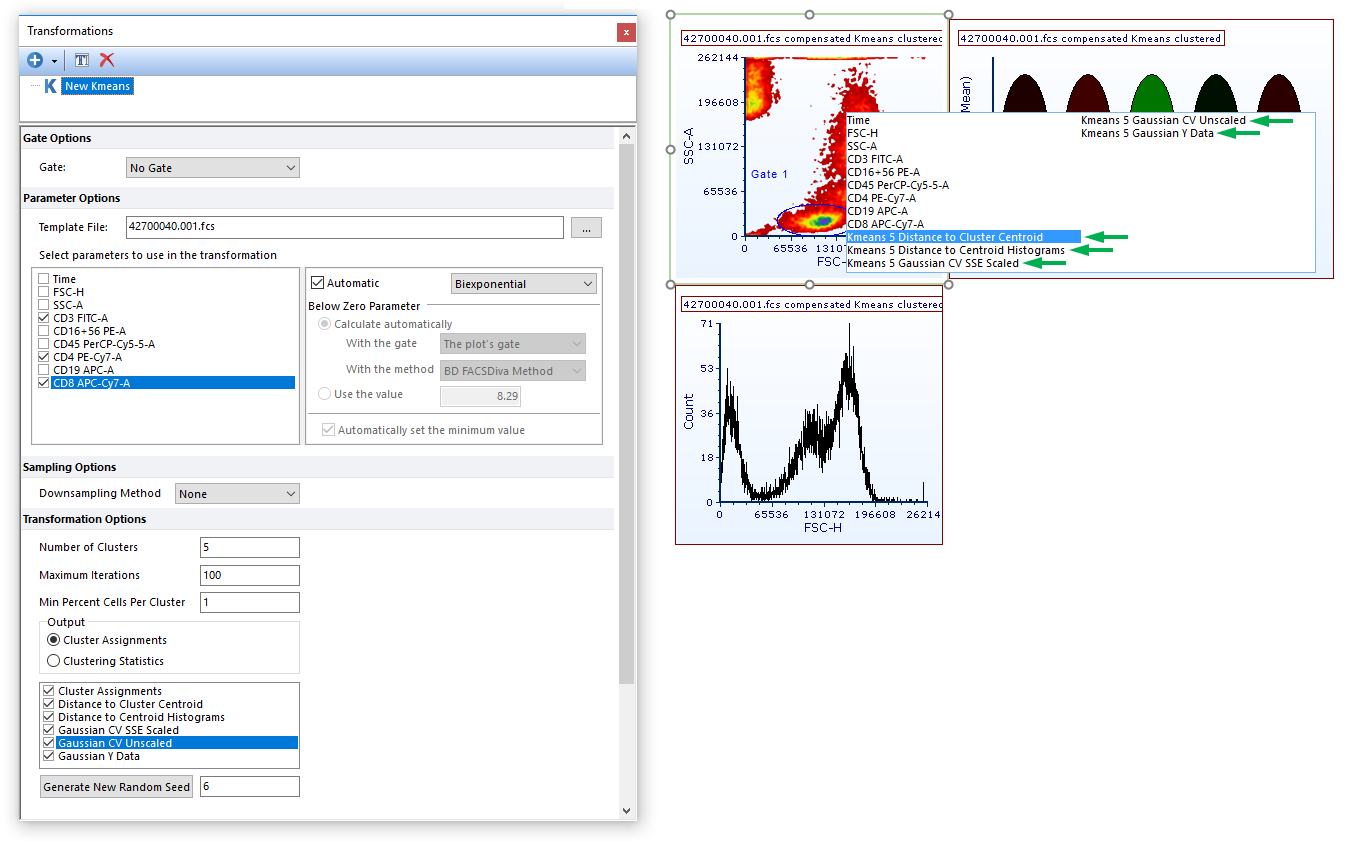
Once a k-means transformation is applied to a plot, the newly created Cluster Assignment parameters can be accessed by clicking on the axis label of the plot Figure 29.34. Please note that heatmaps can only display Cluster Assignments, which is automatically displayed when a k-means transformation is applied.

Figure 29.34 Newly created pareameters can be accessed by clicking on the axis label of the plot of interest.
Gates can now be created on the following Cluster Assignment parameters to specifically select the events within one or more clusters.:
•Cluster Assignments (heatmap only),
•Distance to centroid Histograms(1D/2D plot only),
•Gaussian CV SSE Scaled (1D/2D plot only),
•Gaussian CV Unscaled (1D/2D plot only),
These gates can then be used to back gate clustered events on non-clustering parameters.
Here are some examples of cluster selection using the above-mentioned parameters:
1D plots
Markers can be created on 1D plot displaying clustering parameters as one would on non-clustering parameters. After converting the marker to be a gate, that marker can be used to back gate clustered events on non-clustering parameters (Figure 29.35).

Figure 29.35. Markers can be used to select cluster on 1D plot displaying a clustering parameter. Gate 1 was defined on a density plot and events within it have been clustered. Gate 1 has also been then applied to the k-means transformed histogram. Markers from the histogram were converted to gates and back gated onto the CD4 vs CD3 dot plot.
2D plots
Gates can be created on 2D plots displaying clustering parameters as one would on 2D plots displaying non-clustering parameters. In the example below gates have been created on a 2D plot displaying clustering parameters on both X and Y axis but please consider that a clustering parameter can be displayed together with a non-clustering parameter as well (Figure 29.36).

Figure 29.36. Gates can be used to select clusters on 2D plot displaying one or more clustering parameters. Gate 1 was defined on a density plot and events within it have been clustered. Gate 1 has also been then applied to the k-means transformed plots. In this example 1D Gates (i.e. Markers) have been used to select Cluster 2 and Cluster 3. Events in those gates have been back gated onto the CD4 vs CD3 dot plot.
Heatmaps
Clustering Assignments are automatically displayed on heatmaps when a transformation is applied to them. Well gates can then be used to select one or more clusters (i.e. wells) and then used for downstream analysis. In the following example (Figure 29.37) two well gates have been created on cluster 2 and 3 (well gate 2 is red highlighted on the heatmap).

Figure 29.37. Well gates can be used to select clusters on heatmaps. Gate 1 was defined on a density plot and events within it have been clustered. Gate 1 has also been then applied to the k-means transformed plots. In this example Well Gates have been used to select Cluster 2 and Cluster 3. Events in those gates have been back gated onto the CD4 vs CD3 dot plot.
