Changing Histogram Overlays

Contents
In the course of this example, we will learn how to change histogram overlays to stacked:
For convenience, we are going to start with the same layout as before. The images contained within this section will continue with the layout from the previous section.
1.Select the histogram (see selecting objects).
2.Select the Format→Plot Options→Specific Options command (Figure T3.27).
Alternatively you can Right-click on the histogram and select Format→Histogram→Histogram Specific Options.

Figure T3.27 Format Specific Options Command
A Formatting Histogram Specific Options dialog will appear (Figure T3.28).
3.Check Stacked from the Display multiple overlay data section (![]() ).
).
4.Click OK.
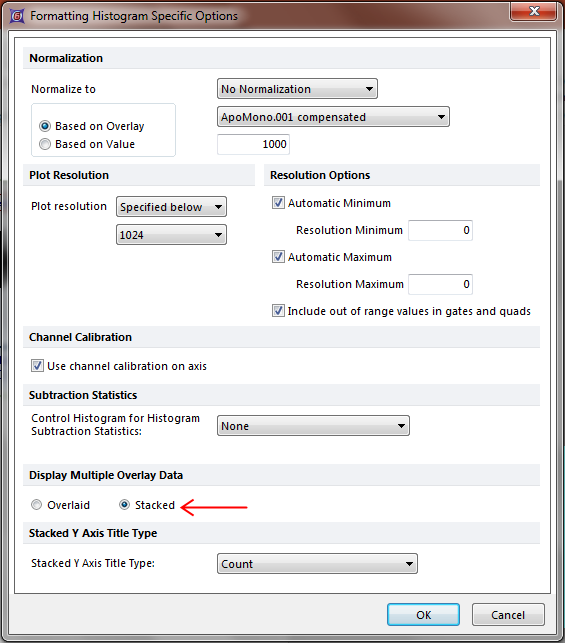
Figure T3.28 Format Histogram (Stacked Overlays)
The histogram will change to stacked (Figure T3.29).

Figure T3.29 Stacked Histograms
To change the histogram overlays back to overlaid press Ctrl+Z on your keyboard.
Alternatively repeat steps 1-4 selecting Overlaid from the Display multiple overlay data section (![]() ).
).
The histogram will change back to the overlaid style (Figure T3.26).
Certain plots can be formatted in 3D.