Color Levels
The Color Levels options are used to control how Density and Contour plot are colored. The significance of each color level can be displayed in the plot legend. In FCS Express 4, 25 discrete color levels were used to generate gradients in Density and Contour Plots. Since FCS Express 5, Density plots are rendered in 256 discrete color levels, resulting in a smoother color gradient.
You can edit the Color Levels for Density or Contour plots in one of two ways:
•Select Density or Contour plot(s) and select Format→2D Options→Color Levels from the ribbon bar (Figure 8.102).
•Right-click on a Density or Contour plot, select Format from the pop-up menu, and choose Density Options→Color Levels or Contour Options→Color Levels.
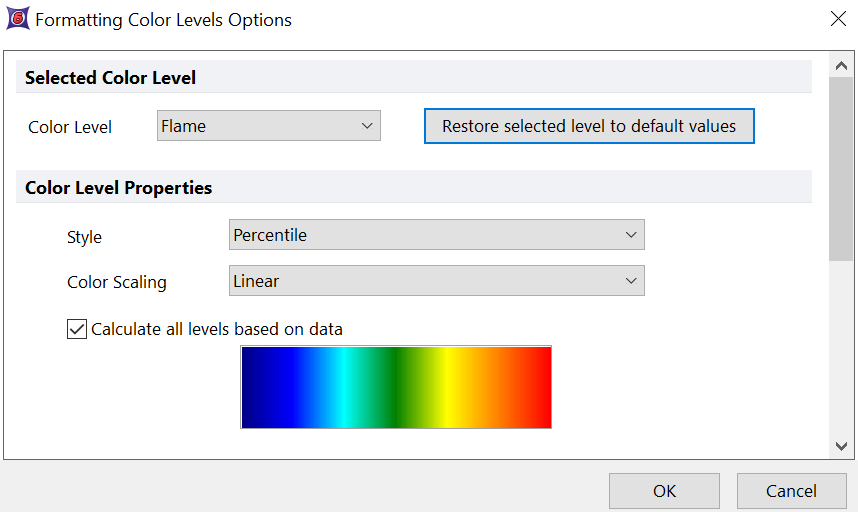
Figure 8.102 Contour Level Options
For Density and Contour plots, each bin is colored based on the value that bin has for a specific parameter. By default, both Density and Contour plot are colored based on density, thus based on the number of events included in each bin. However, since FCS Express 6, any parameters can also be used to represent a density color shading. The parameter the color is based on is the one shown in the legend and can be changed both through the legend itself and through the Overlay dialog (see the Color based on option).
Note: Colors are calculated taking into consideration both Plot Resolution and Smoothing. The plot legend reports the actual values used to calculate the color.
Three options can be selected to customize the way bins are colored:
1. Color level
Color level options define the color palette (see figures below).
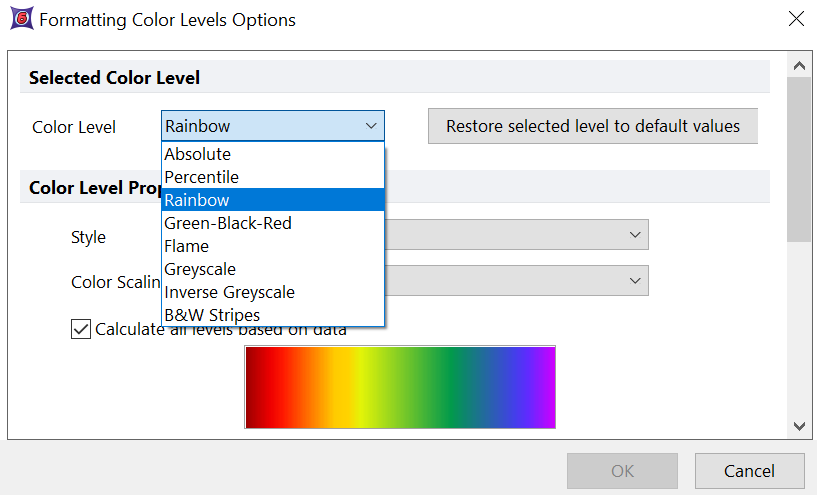
Color Level choices for density plots
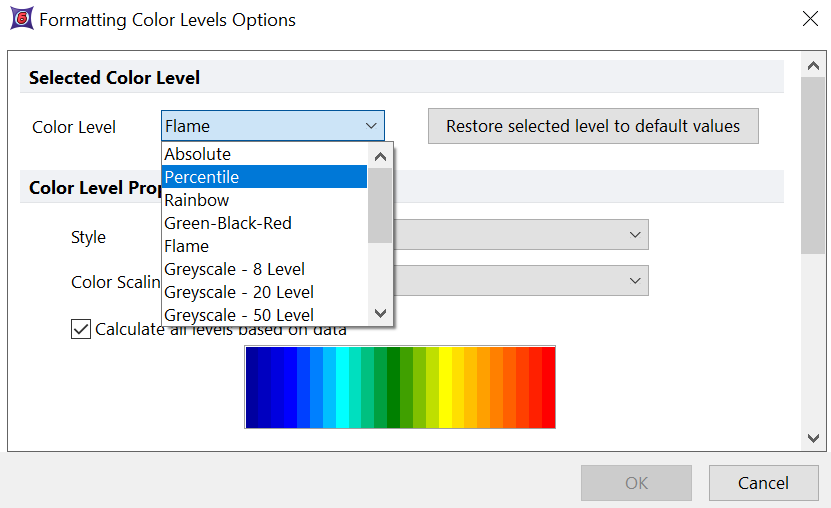
Color Level choices for contour plots
The choices in the list differ for each type of plot:
•Possible choices for Density plots are: Absolute or Percentile (the number of levels is the number of colors shown in the list), Rainbow (240 color levels), Green-black-red (250 color levels), Flame (252 color level), Greyscale and Inverse greyscale (255 color levels), B&W stripes (240 color levels).
•Possible choices for Contour plots are: Absolute or Percentile (the number of levels is the number of colors shown in the list), Rainbow (24 color levels), Green-black-red (8 color levels), Flame (24 color level). For the remaining choices the number of levels is specified in the drop down menu.
When you select a color level category, the colors in the chosen palette will be displayed in the bottom half of the dialog. In addition, the Preview and Restore buttons in the Format dialog provide a convenient means for evaluating each color scheme with your data. Note that the Preview and Restore buttons are available only when the Format dialog is accessed by right clicking on the plot. They are not available when the Format dialog is accessed via the Ribbon bar.
Most of the Color Level schemes are simply defined by their names, ie, Green-Black-Red uses those colors in the scheme, but two may require further explanation:
•Absolute. Color levels may be defined by the user based on absolute values (see below, Color Level Properties). If Calculate Levels based on data is checked, color levels are instead defined by the software.
•Percentile. Color levels may be defined by the user based on percentiles (see below, Color Level Properties). If Calculate Levels based on data is checked, color levels are instead defined by the software.
The color for an individual level can be changed by selecting the color and clicking the ellipsis inside the color box. A level can be added or removed by selecting the appropriate level and pressing the ![]() (Add) or
(Add) or ![]() (Remove) buttons. To access these settings for plots displaying Color Levels other than Absolute and Percentile, uncheck Calculate all levels based on data.
(Remove) buttons. To access these settings for plots displaying Color Levels other than Absolute and Percentile, uncheck Calculate all levels based on data.
When selecting grayscale, the shades of gray are automatically displayed for you. You will not be able to edit the shades for an existing level.
You can return to the Rainbow style (or your current default option for 2D Contour or Density plots) by clicking on the Restore selected level to default values button. Clicking the Default button will also update any plots created in a Version 4 layout to the newest default color palette for the current version.
2. Style
Style options defines how color levels are used to color the data.
•Fixed range. The range of the data in the parameter that was selected for the coloring is divided into evenly spaced color levels. Settings may also be manually defined rather than based on data.
•Percentile. The range of the data in the parameter that was selected for the coloring is divided into color levels, so that each color level contains the same number of data causing the colors to be centered around the median. Settings may also be manually defined rather than based on data.
•Mean +- SD. The range of the data in the parameter that was selected for the coloring is divided into color levels, so that the central level is centered around the mean of the data and the color shapes are normally distributed based on the standard deviation specified by the user.
•Threshold. The range of the data in the parameter that was selected for the coloring is divided into only two levels regardless of the Color Level selected. The two colors can be customized by the user. The color of each bin will be decided based on the threshold specified by the user.
3. Color Scaling
When Logarithmic is selected, the data (i.e. bin values) are log-transformed before dividing the range of the data into color levels.
4. Unchecking Calculate all levels based on data - Manual Settings
For Fixed range and Percentile styles you may uncheck the Calculate all levels based on data check box to manually define your color level settings or fix the low and high levels with two settings.
•Specify the low and high level; the rest will be calculated automatically, Figure 8.103: User may enter any value within limits for the low and high bounds of the color levels. Intermediate increments for the color levels will be calculated automatically using the current Color Level choice. This option is particularly useful when comparing plots with tSNE transformations applied and visualizing different color based on parameters in order to visualize color mappings within the same range/scale.
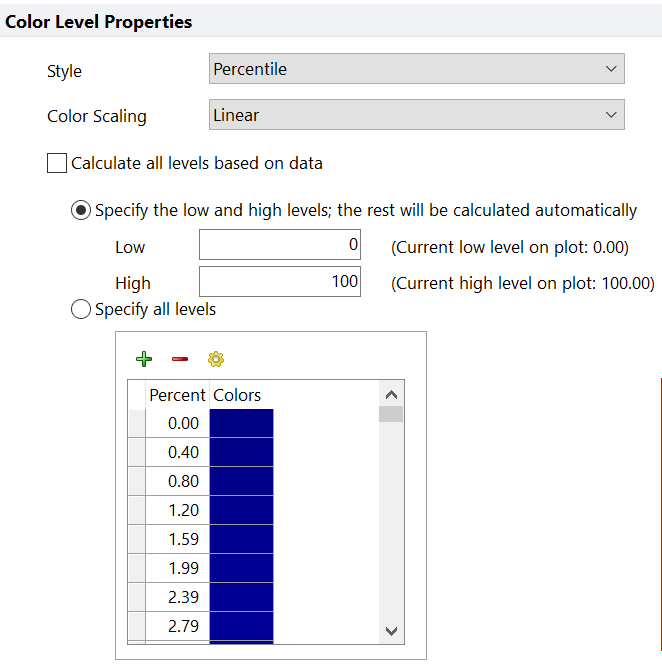
Figure 8.103 - Choosing Specify the low and high levels; the rest will be calculated automatically allows users to set a fixed low and high bound for color scaling.
•Specify all levels: The user may specify any levels manually by clicking on the green + button to add a value or the red - button to remove a color level. Alternatively, you may click on the yellow gear icon to launch the Increment Information dialog, Figure 8.104, to more automatically set increment levels based on user input of the lowest and highest color level, and how many increments to add in between. The Increment Information dialog will allow you to adjust the following settings in the table below.
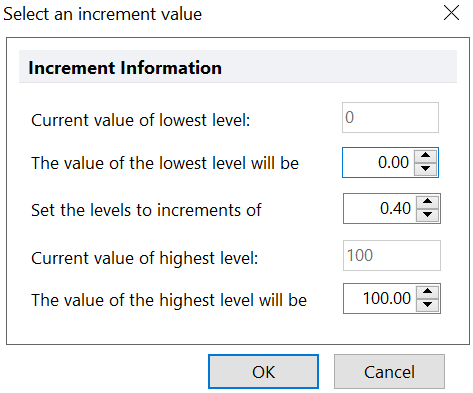
Figure 8.104 - The Select an increment value dialog allows you to automatically set increments for color levels based on the desired low value, high value, and increment value between discreet color levels to use.
Setting |
Definition |
|---|---|
Current value of lowest level |
the value of the lowest color level currently showing on the plot. |
The value of the lowest level will be |
the new value of the lowest color level you would like to set. |
Set the levels to increments of |
the incrementation value between discreet color levels that you would like to set. |
Current value of highest level |
the value of the highest color level currently showing on the plot. |
The value of the highest level will be |
the new value of the highest color level you would like to set |
The color gradient created will be based on the colors of the first and last color in the list, figure 8.105. For instance, if the first color level is purple and the last color level is black you will arrive at a purple to black color gradient. Clicking on ellipsis button (...) on the individual color levels will reveal the color palette to choose which colors to use for the first and last color level.
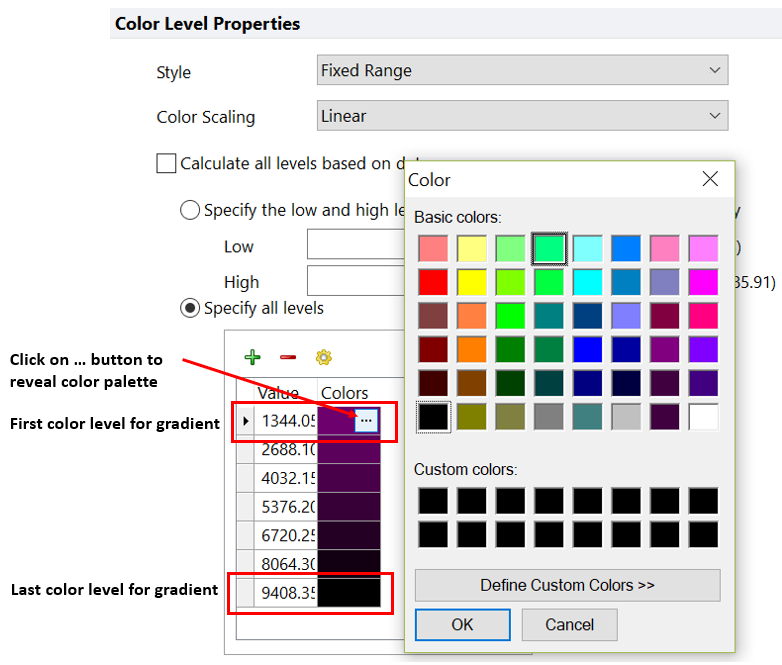
Figure 8.105 - The first and last color levels in the list will determine the beginning and ending colors for the gradient. Clicking on the ... button within the color will allow you to pick a new color for the color palette.
Examples
Figure 8.106 below depicts some examples of plots colored with different combinations of Color Levels, Styles and Color Scaling:
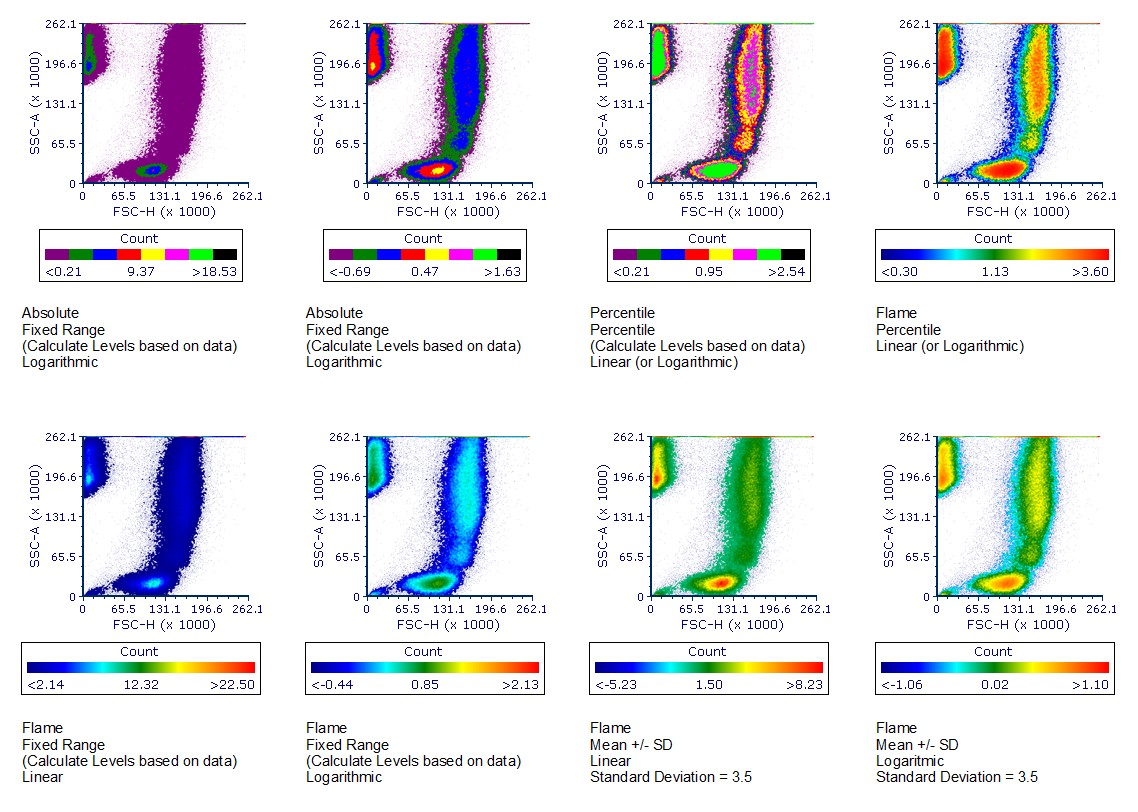
Figure 8.106. Example of different color combinations. The text below each plot reports the Color Levels, the Styles and the Color Scaling used. Additional setting (e.g. "Calculate Levels based on data" and "Standard Deviation") are also reported.
