Formatting Heat Map Overlays
Once overlays have been added to a Heat Map, they can be edited similarly to other overlays much like Histogram Overlays and 2D Plot Overlays.
The Overlays option controls the parameter, statistics to display, compensations, transformations, gates, and appearance of heat map overlays.
All heat maps have at least one overlay representing a file and well parameter to display. You can add additional overlays by any of the following methods:
•Right-click on the plot and select Add overlay from the pop-up menu, or
•Drag-and-drop file(s) from the Data List onto the plot you wish to overlay, or
•Drag-and-drop a plot from the layout onto the plot you wish to overlay.
You can edit overlays in one of two ways:
•Select the heat map and use the Format→Plot Options→Overlays command.
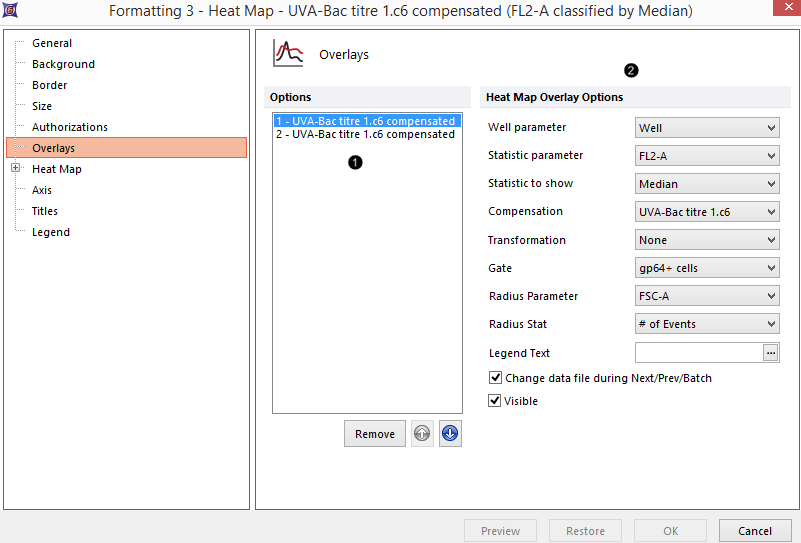
•Right-click on the map, select Format from the pop-up menu, and choose the Overlays category (Figure 32.17).

Figure 32.17 - Editing a Heat Map Overlay
In the dialog, a list of all the overlays on the heat map will appear in the list box to the left ![]() . You can select one or more overlays using standard Microsoft Windows techniques, including Shift-Click and Ctrl-Click. The properties on the right
. You can select one or more overlays using standard Microsoft Windows techniques, including Shift-Click and Ctrl-Click. The properties on the right ![]() pertain to the currently selected overlay(s). If multiple overlays are selected, the information will appear blank for those properties that are not identical in all selected overlays. If the properties are not blank, then they are identical for all selected overlays. Changing an option will change that property for all selected overlays. For instance, if you select three overlays and change the Gate, the Gate for all three overlays will be modified.
pertain to the currently selected overlay(s). If multiple overlays are selected, the information will appear blank for those properties that are not identical in all selected overlays. If the properties are not blank, then they are identical for all selected overlays. Changing an option will change that property for all selected overlays. For instance, if you select three overlays and change the Gate, the Gate for all three overlays will be modified.
To remove an overlay from a plot, select the overlay (or multiple overlays) and press the Remove button.
To change the order of selected overlay(s) in the legend, use the blue up and down arrows (![]() ).
).
Heat Map Overlay Options are explained in the table below.
Option |
Explanation |
|---|---|
Well parameter |
Is the X parameter (well parameter) displayed on the heat map. |
Statistic parameter |
A drop-down menu to select the parameter from which a statistic will be chosen to be displayed. Please refer to the Setting the Parameter to Display chapter for more details. |
Statistic to show |
A drop-down menu to select the statistic to show as an overlay on the heat map. Please refer to the Setting the Parameter to Display chapter for more details. |
Compensation |
If compensation definitions are set, select the definition to use when compensating the data in the overlay. |
Transformation |
If transformations are applied to the data set, select the transformation to use when transforming the data in the overlay. |
Gate |
If gates are defined, select the gate that will be used to limit the data that is displayed on the histogram. |
Radius Parameter |
Optional: A drop-down menu to select the parameter from which a Radius statistic will be chosen. A Radius parameter must be chosen to use a Radius statistic. |
Radius Statistic |
Optional: A drop-down menu to select the statistic to adjust the radius of each well. |
Legend Text |
The text that will appear in the legend beside the symbol for the overlay. If this field is blank the file name of the overlay will appear. Insert keywords from the header of the data file by pressing the ellipsis next to the legend text. You can also display the current gate applied to the overlay by typing "<$FCSE_GATEFORMULA>" into the legend text. |
Change data file during Next/Prev/Batch |
If this option is checked, the data file for this overlay will change when doing batch processing, or selecting Previous File or Next File. This option is usually only disabled for a control histogram, where you have multiple overlays, and want the control to stay the same all of the time. |
Visible |
You can hide overlays on a heat map without removing them. Select the overlay file from the list and uncheck Visible. Check Visible to show the overlay again. |
