Inserting a Proliferation Histogram
Proliferation histograms are a special subset of one dimensional plots that automatically model proliferation statistics according to the fit parameters you set.
Note: The axis scale of Proliferation histograms should be set to Log.
Prior to inserting a Proliferation histogram for curve fitting analysis, you should gate your cell population on the desired cells. See the proliferation tutorial for further information.
To insert a Proliferation histogram, use the Insert→1D Plots→Proliferation command. If necessary, change the x-axis parameter to reflect the appropriate parameter for the proliferation dye used in the experiment, such as CFSE or CellTrace Violet, for example.
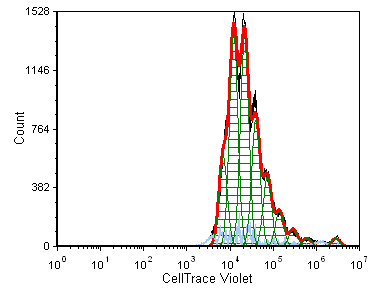
An example of a Proliferation histogram is shown in Figure 26.1.

Figure 26.1 Proliferation Histogram
The default colors are explained in the table below.
Color |
Explanation |
|---|---|
Black |
Overall histogram contour. This includes all the data and does not represent an output of the fitting algorithm. |
Red |
Overall contour of the fitted data. This excludes what the algorithm determines to be noise. |
Light Blue |
This is the data that the algorithm determines to be noise, and is not included in the statistics. |
Green |
Modeled populations of proliferating cells. These are the actual curves fitted to the data, representing the parent, undivided population, and all the proliferating generations. |
