Resizing (and eventually locking) marker boundaries via the Formatting Markers Dialog
Markers end points may be set and/or locked to any number or numeric token via the Formatting Markers dialog in the following way:
•With the plot containing the marker you want to resize in selected or edit mode, use the Format→1D Options→Markers command from the ribbon bar (alternatively, right click on the plot, choose Format and select the Markers category) to launch the Formatting Markers dialog.
•In the list of Marker's highlight the marker you would like to resize by clicking on it.
•In the Marker Options section, Low and High represent the channel numbers of the left and right marker boundaries, respectively.
•Change the Low and/or the High value by either typing in numbers (decimal values may also be used) or by clicking on the T icon at the right of the bound to select a numeric token. If the T icon is selected, then choose Statistic from the Select a Token Type dialog and select the numeric token of interest.
•Optionally, check the Locked check box to lock the marker bound to the specified value. When the marker bound is locked to a token, the marker bound will automatically resize when the token value changes. When a marker bound is locked, the marker bound will not be resizable when attempting to move the marker endpoint with the mouse.
•Clicking OK in the Formatting dialog will apply the changes.
Please note
When a marker bound is not locked to the specified value, the marker bound will still remain resizable by moving it using the mouse. When this happens, the manually inserted value (or the token value, if a token is used to set the marker bound) will be replaced with the position defined using the mouse. To avoid this, marker bounds can be locked to the given value via the Formatting Markers dialog.
Although marker end points can be set and locked to any numeric token, a useful application of this feature is setting and locking marker end points together so that moving a marker end point will automatically cause an end point on a different marker to update accordingly while preventing additional independent adjustments of the markers. Markers may be linked within the same plot or between different plots using these features.
Below is a use case examples of linking and locking markers together via the Formatting Markers dialog.
To link and lock two or more marker end points together:
Linking marker end points is accomplished by setting the Low or High bound for one marker to use a token value for the Low or High bound of a separate marker. In the following example, both markers have been created on the same plot and we will link the High bound of Marker 1 to the Low bound of Marker 2 to create a set of markers that will define positive and negative population.
1. Begin with a layout in which two markers have already been created on one plot.
2. Double click on the plot on which the markers were created to launch the Formatting dialog.
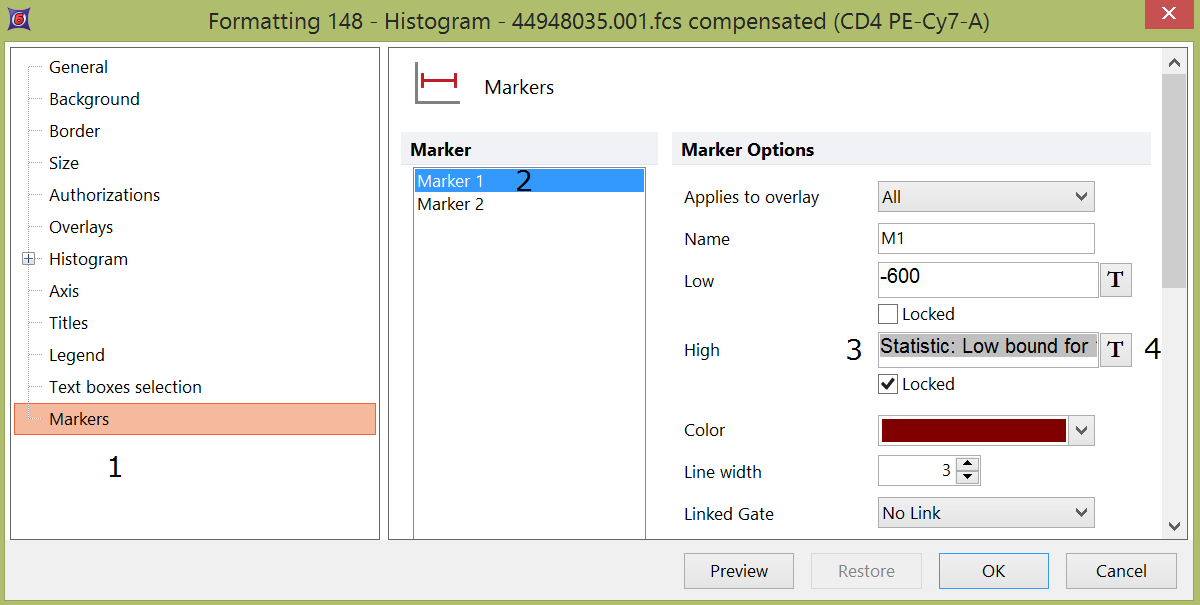
3. Choose the Markers category (Figure 9.37 below- Number 1).
4. Select the first marker (Marker 1) from the Marker list (Figure below - Number 2).
5. Delete the contents of the field for High in the Marker Options section (Figure below - Number 3).
6. Click on the T icon to choose a token (Figure below - Number 4).
7. Choose Statistic from the Select a Token Type dialog.
8. Click Insert. The Create Statistic dialog opens.
9. Choose the Statistic category on the left.
10.Select M2 from the Select a marker drop down.
11. Choose Low bound from the Statistic list.
12. Click OK.
13. Check the Locked box of the High bound of Marker 1 in the Marker Options.
14. Click OK in the Formatting dialog.
Since the Locked option has been set, when the low bound of Marker 2 is adjusted, the high bound of Marker 1 will now adjust automatically to match. For the same reason, the high bound of Marker 1 cannot be adjusted independently. Please note that dragging a new token value onto the marker will update the value without having to unlock it first.

Figure 9.37 - Formatting a marker bound to use the high or low bound of another marker.
