Histogram Markers
The Markers option allows the user to control the formatting of histogram markers.
Please also see the sections on Using Markers for additional details on creating, editing, resizing, linking, and locking markers.
You can edit markers in one of two ways:
•Select the histogram(s) and use the Format→1D Options→Markers command.
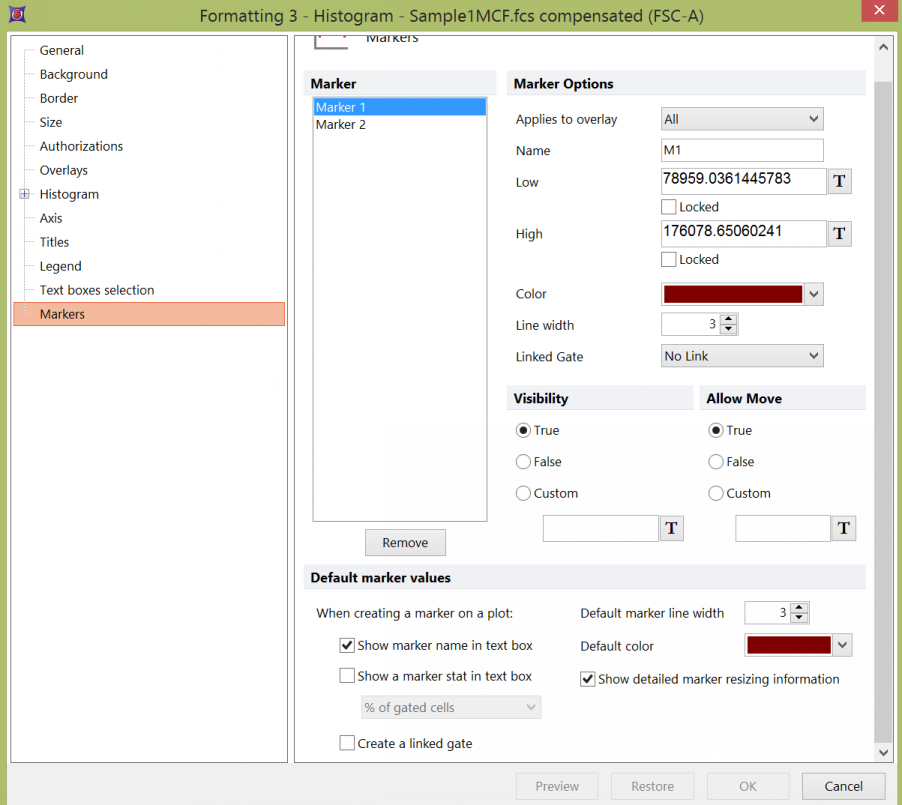
•Right-click on the histogram, select Format from the pop-up menu, and choose the Markers category (Figure 8.87).

Figure 8.87 Formatting Markers Dialog
In the dialog, a list of all the markers on the histogram will appear in the Marker list box. You can select one or more markers using standard Microsoft Windows techniques, including Shift-Click and Ctrl-Click. The properties on the right pertain to the currently selected marker(s). If multiple markers are selected, the information will appear blank for those properties that are not identical in all selected markers. If the properties are not blank, then they are identical for all selected markers. Changing an option will change that property for all selected markers. For instance, if you select three markers and change the Color, the Color for all three markers will be modified. To remove a marker, select it and press the Remove button.
Marker properties are explained in the table below.
Option |
Explanation |
|---|---|
Applies to overlay |
Select which overlay(s) the marker applies to. Statistics will be calculated for the overlay that the marker applies to. |
Name |
The name of the marker that appears in text boxes on a plot when the marker name token is selected. |
Low |
The low channel boundary of the marker. Tokens may be used to define low bound by clicking on the T icon. The locked check box locks the low bound position to a manually entered or token defined value. Additionally, A lock may be overridden without accessing the formatting dialog by dragging a new token value onto the marker endpoint. |
High |
The high channel boundary of the marker.Tokens may be used to define low bound by clicking on the T icon. The locked check box locks the high bound position to a manually entered or token defined value. Additionally, A lock may be overridden without accessing the formatting dialog by dragging a new token value onto the marker endpoint. |
Color |
The color that the marker will be drawn in. |
Line width |
The line width of the marker. |
Linked Gate |
The gate that the marker is linked to. To break the link between the marker and a gate select No Link. |
Choose to show the marker "True", hide a marker without removing it "False", or make it visible based on a conditional value "Custom". The Custom option allows you define visibility of the marker based on a token or value that evaluates to a conditional expression. Any tokens or values may be used to set a conditional custom value and may be inserted via right click in the field, Insert Token or by clicking on the T token icon. The marker will only be visible if the token evaluates to True. |
|
Allow Move |
Choose to allow moving the marker "True", disallow a marker move "False", or make moving the marker based on a conditional value "Custom". The Custom option allows you define the move status of the marker based on a token or value that evaluates to a conditional expression. Any tokens or values may be used to set a conditional custom value and may be inserted via right click in the field, Insert Token or by clicking on the T token icon. The marker will only be allowed to move if the token evaluates to True. |
Default marker values |
When a marker is created, you can choose whether or not to show the marker name and/or stat in a text box, and select the default line width and color. If marker stat is enabled, you can choose which statistic to display from the drop-down list. If Show detailed marker resizing information is checked, the marker boundaries will appear above the marker and lines will drop to the axes to show where the marker boundaries will be during resizing. If Create a linked gate is checked, when new markers are created on this plot, a gate linked to the marker will automatically be created. |
Show detailed marker resizing information |
Enables drop down lines at the end of each marker to show the position on the axis as well as displays marker low and high boundary values. |
When checked, any new markers created on the histogram will be automatically converted to linked gates. Any existing markers on the plot will still need to be manually linked to a gate. |
