Proliferation Statistics

Contents
When performing a Proliferation Analysis, FCS Express automatically calculates several proliferation fit and proliferation population statistics from your data. To change user preferences for which of these statistics are displayed, refer to the Proliferation Fit Statistics preferences and Proliferation Population Statistics preferences sections of the Statistic Preferences sub chapter of Formatting Objects.
To open a Proliferation statistics window, right-click on the Proliferation histogram, move the cursor over Statistics in the pop-up menu, and select the desired type from the submenu (Figure 26.4).

Figure 26.4 Choosing Proliferation Statistics
The first choice, Standard Histogram Statistics, represents the statistics available for non-Proliferation histograms.
Proliferation Fit Statistics describe the fitted data. Figure 26.5 shows an example of proliferation fit statistics. The statistic equations that are calculated are shown in the table below.

Figure 26.5 Proliferation Fit Statistics
The statistics shown in this window are explained in the table below
P is the total number of peaks found (where P0 is the undivided generation).
N is the number of cells in a generation.
μ is the mean of a population.
All statistics below assume that no cell death occurred.
Statistic |
Equation |
Description |
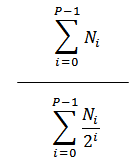
Proliferation Index |
|
The average number of cells that an initial cell became. |
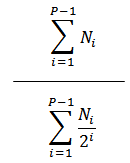
Division Index |
|
The average number of cells that a dividing cell became. |
# of Original Cells |
|
The number of cells that existed prior to any division. |
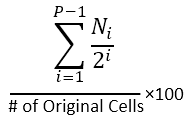
% Divided |
|
The percentage of the original cells that divided. |
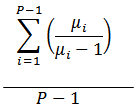
Peak Ratio |
|
The average ratio of all the peak positions. |
# of Fitted Cells |
|
The total number of cells calculated by the fitting. |
Degrees of Freedom |
N/A |
The number of channels minus the number of fit parameters minus 1. |
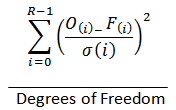
R-Chi Square |
|
An estimate of the “goodness of fit” of the model. Values under 5 indicate a good fit. R is the range of the data. O(i) is the data value at i. F(i) is the fit value at i. σ(i) is the measurement error at i. Measurement error is estimated by comparing a smoothed version (7 point smoothing). |
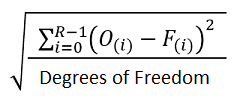
RMS Error |
|
An estimate of the “goodness of fit” of the model. R is the range of the data. O(i) is the data value at i. F(i) is the fit value at i. |


Proliferation Population Statistics pertain to the multiple generations that have proliferated during the experiment (Figure 26.6). The statistic equations that are calculated are shown in the table below.

Figure 26.6 Proliferation Population Statistics
An explanation of the shown in this window is in the table below. Note that all statistics are generation-specific.
Statistic |
Description |
Peak Channel |
The x-value of the peak. |
Peak Value |
The y-value of the peak. |
Log Std. Dev. |
The Standard Deviation (Std. Dev.) of the log-scaled data. The Std. Dev. is a measure of the variation from the average for the events, or the square root of the variance. Log values are used due to histogram data being binned in log space. |
Log CV |
The coefficient of variation (CV) of the log-scaled data. The CV is a measure of the distribution of your data and is equal to the standard deviation divided by the mean. Log values are used due to histogram data being binned in log space. |
Peak Ratio |
The ratio of the fluorescence to the previous generation's fluorescence. The ideal is 0.5. |
# of Cells |
The number of cells calculated by the fitting. |
# of Orig Cells |
The number of original cells (i.e., cells prior to any cell division) giving rise to the cells calculated by the fitting. |
% of Orig Cells |
The number of original cells expressed as a percent of the total number of original cells. |