Quadrants
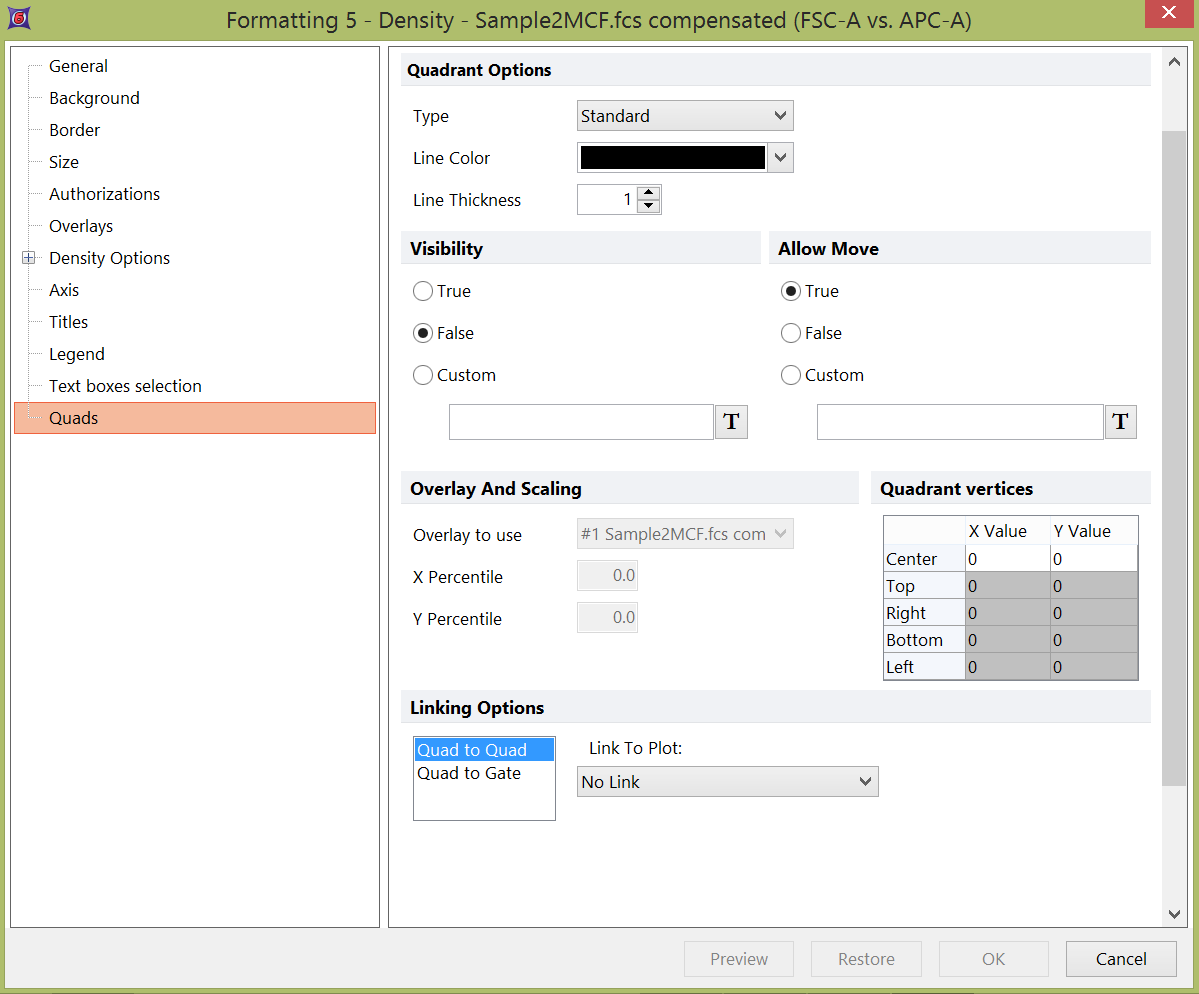
The Quadrants category allows you to manipulate the quadrants on a 2D plot. Quadrants can also be created and their positions adjusted directly from the plot.
You can edit quadrants in one of two ways:
•Select the 2D plot(s) and use the Format→2D Options→Quadrants command.
•Right-click on the 2D plot, select Format from the pop-up menu, and choose the Quads category (Figure 8.99).

Figure 8.99 Formatting Quadrants dialog
The options on the left side of the dialog are explained in the table below.
Option |
Explanation |
|---|---|
Type |
The type can be one of the following: •Standard: All four quadrants are rectangular. •Floating: Quadrants can be any shape •X Percentile: The quadrants are rectangular, and the X position of the quadrant is determined automatically based on the value in the X Percentile edit field. Please refer to the note at the bottom of this chapter for details about how out of range events are handled by percentile quadrants. •Y Percentile: The quadrants are rectangular, and the Y position of the quadrant is determined automatically based on the value in the Y Percentile edit field.Please refer to the note at the bottom of this chapter for details about how out of range events are handled by percentile quadrants. •Both Percentile: The quadrants are rectangular, and the X and Y positions of the quadrant are determined automatically based on the value in the X Percentile and Y Percentile edit fields, respectively. Please refer to the note at the bottom of this chapter for details about how out of range events are handled by percentile quadrants. |
Line color and thickness |
The color and thickness that the quadrant lines will be drawn in. |
Choose to show the quad "True", hide a quad without removing it "False", or make it visible based on a conditional value "Custom". The Custom option allows you define visibility of the quad based on a token or value that evaluates to a conditional expression. Any tokens or values may be used to set a conditional custom value and may be inserted via right click in the field, Insert Token or by clicking on the T token icon. The quad will only be visible if the token evaluates to True. |
|
Allow Move |
Choose to allow moving the quad "True", disallow a quad move "False", or make moving the quad based on a conditional value "Custom". The Custom option allows you define the move status of the quad based on a token or value that evaluates to a conditional expression. Any tokens or values may be used to set a conditional custom value and may be inserted via right click in the field, Insert Token or by clicking on the T token icon. The quad will only be allowed to move if the token evaluates to True. |
Quadrant vertices |
The precise coordinates of the quadrant vertices. These can be entered manually for precise control over quadrant positioning. Note: Quadrants are stored in 256x256 resolution; therefore, not all possible values for quad vertices will be available. |
Overlay to use |
Which overlay to use when calculating the percentiles for the X Percentile and Y Percentile quadrant types. |
X Percentile |
Which percentile to use for the X Percentile and Both Percentile quadrant types. |
Y Percentile |
Which percentile to use for the Y Percentile and Both Percentile quadrant types. |
Quadrants can either be linked to other quadrants or to gates. You can change the current links from the Linking Options area of the dialog.
To change the quadrant to quadrant link, select Quad to Quad and choose the plot you want to link to the current plot. The quadrants on the current plot will become a "slave" to the quadrants on the linked plot, i.e., when the properties of the quadrants on the linked plot change, the quadrants on the current plot will also change. For example, by linking plots to an isotype control plot, the quadrants in the linked plots will automatically adjust if the isotype control quadrants are adjusted.
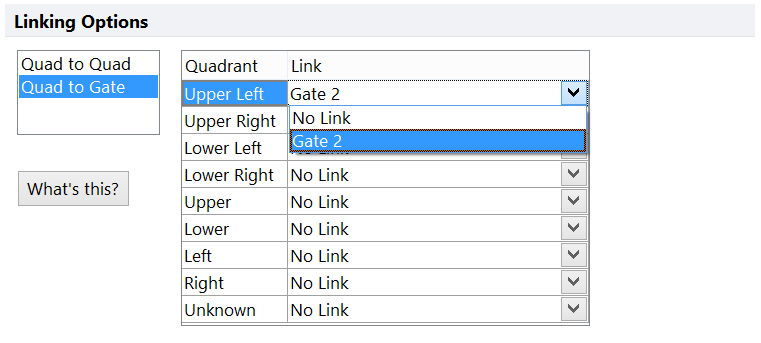
If quadrants on the plots have been converted and linked to gates, these links can be changed or broken in the Quad to Gate dialog. The dialog will appear similar to Figure 8.100.

Figure 8.100 Linking Quad to Gate
In order to change or break the link, select the down arrow to the right of the drop-down list. Select No Link to break the link between the quadrant and the region. Below the No Link item will be a list of gates previously linked to other quadrants on this plot, and now available for linkage to the selected quadrant. A gate can only be linked to one quadrant in a layout. If the desired gate does not appear in the drop-down list, it is already linked to another quad on the current plot or is not derived from these quadrants at all.
Notes regarding percentile quadrants and out of range events
Sometimes a considerable number of events are out of range for a given parameter and thus are assigned to have the maximum value for that parameter. If the top X% of events all equal the maximum value on the plot then the vertex of the last X percentiles will all be set at the maximum value. For an example in which the top 30% of events are all set to the maximum value for a given parameter the vertex of all the percentiles quadrants above the 70th percentile will all be set at the maximum value (Figure 8.101 below. Note the middle two and far right plots.).

Figure 8.101 In this FCS file more than 30% of the events are set at the maximum value for the SSC parameter. Percentile quadrants have been set at different percentiles of the SSC parameter. Note that the vertex of percentiles from the 70th percentile and above are all at the maximum values for the SSC parameter.
