Resizing marker boundaries by dragging and dropping tokens for the upper or lower boundaries
A marker endpoint may be set and locked to a token value by dragging and dropping a numeric token onto it. The marker endpoint will be set to the token value and will be automatically resized as soon as the token value will change.
Please note: The marker bound will automatically be locked to the token, thus the marker bound will not be resizable by using the mouse. The lock can be removed via the Formatting Markers dialog and unchecking the Locked check box of the boundary of interest. Additionally, dragging a new token value to the marker end point will override the original lock and lock the newly dragged value to the end point.
Below are two use case examples of setting and locking marker end point to token using drag and drop:
Using a token in a statistics table to link two markers together.
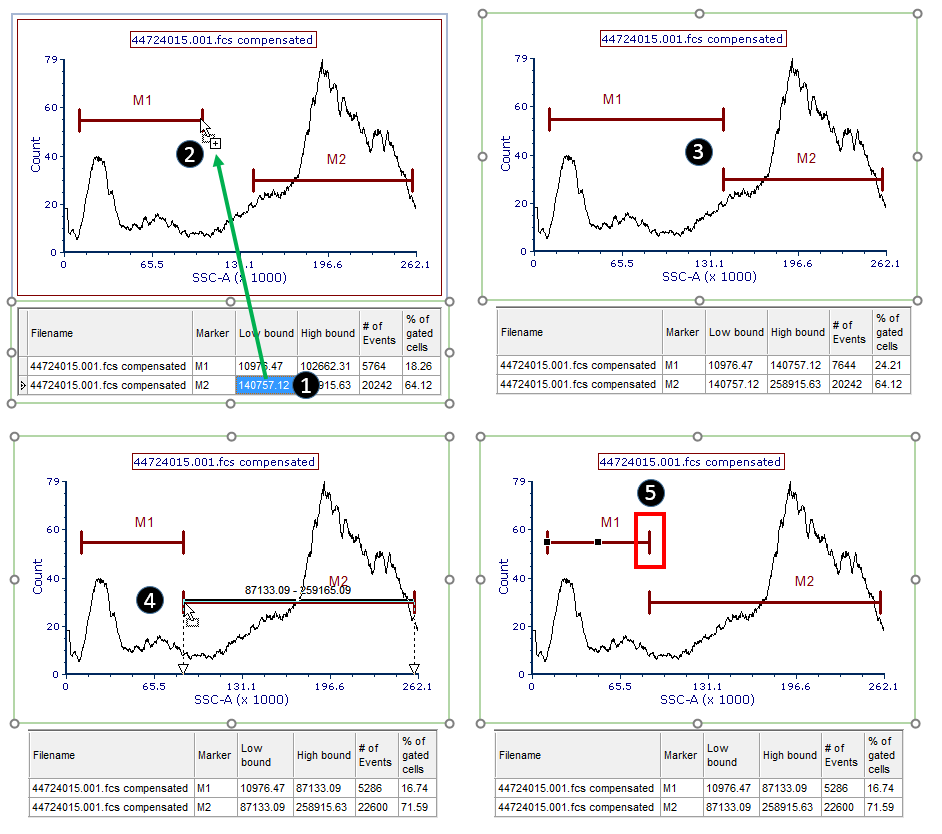
In this use case the high bound of a marker (M1) is set and locked to the low bound of another marker (M2). The action will be performed via dragging and dropping the token referring to the low bound of marker M2 from a statistics table to the high bound of marker M1 (Figure 9.38). Please note that in this example, the two markers are within the same plot, but the same procedure may be used for markers which reside on different plots as well.
1. Left click the cell of the stat table containing the token of interest to select it (Figure below - Number 1).
2. While pressing the left mouse button drag the cell on top of the right end point of marker M1. Note that the cursor will appear as ![]() (Figure below - Number 2).
(Figure below - Number 2).
3. Release the mouse button on top of the right end point of Marker M1. The position of the right end point of Marker 1 now matches the value of the token (Figure below - Number 3).
4. When token value will changes by moving the low bound of marker M2, the right end point of marker M1 will change accordingly (Figure below - Number 4). Please note that the opposite is not true. Since the right end point of marker M1 is automatically locked to the left end point of marker M2, the right end point of marker M1 will not be resizable by using the mouse (Figure below - Number 5, note the absence of the resizing handle at the right-bound). The lock can be removed via the Formatting Markers dialog by unchecking the Locked check box of the boundary of interest.

Figure 9.38. The figure shows how to set and lock two marker end points together by dragging and droppging a token contained in a statistics table.
Using a token in a text box to link a marker to it.
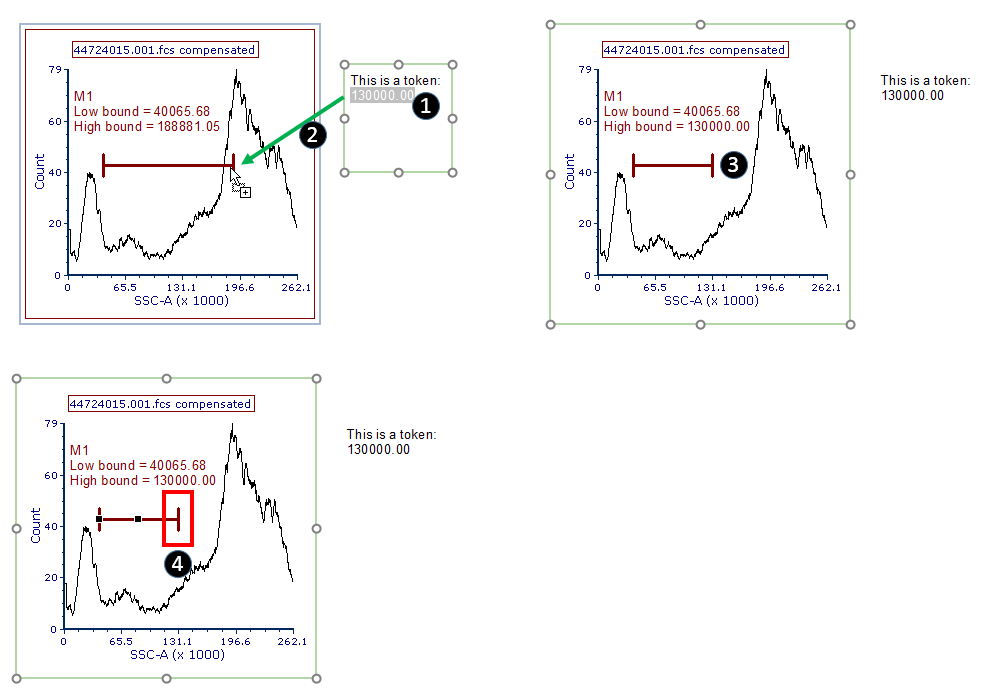
In this use case example a statistic token in a text box will be dragged and dropped to the end point of a marker (i.e. Marker M1) to set that end point to be equal to the value of the token (Figure 9.39). Please not that any type of statistical tokens, included custom tokens, can be used when they exist in a text box.
1. Highlight the token of interest (Figure below - Number 1).
2. Left click on the highlighted token and drag it on top of the right end point of Marker 1. Note that the cursor will appear as ![]() (Figure below - Number 2).
(Figure below - Number 2).
3. Release the mouse button on top of the right end point of Marker M1. The position of the right end point of Marker 1 now matches the value of the token (Figure below - Number 3).
4. When the token value changes, the right end point of marker M1 will change accordingly. Please note that the opposite is not true. In addition, since the right end point of marker M1 is automatically locked to the token, the right end point of marker M1 will not be resizable by graphically acting on it using the mouse (Figure below - Number 4, note the absence of the resizing handle at the right-bound). The lock can be removed via the Formatting Markers dialog by unchecking the Locked check box of the boundary of interest.

Figure 9.39. The figure shows how to set and lock a marker end point to a token by dragging and dropping the token from a text box.
