Setting Bead Gates and Markers
In the course of this example, we will:
•Learn how to gate the beads.
•Learn how to apply markers to the fluorescence peaks of the beads.
•Set up channel calibration defaults for FCS Express.
1.Open a new, blank layout.
2.Insert a Forward vs Side scatter dot plot of the file ChannelCalibration.001 located in the Tutorial Sample Data archive. For information on how to do this, please see the tutorial on Inserting Plots.
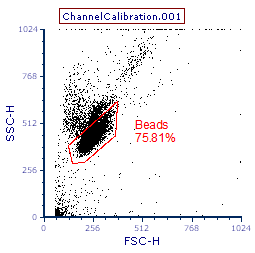
3.Create a polygonal gate around the beads.
The gate should look similar to the one shown in Figure T23.1. For more information on creating gates, please refer to the Gating tutorial.

Figure T23.1 Polygonal Gate
4.Insert a new histogram of the same file.
5.Set it to show channel FL3-H.
6.Apply the Beads gate to the new histogram.
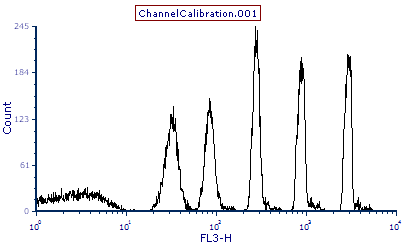
The histogram should appear similar to Figure T23.2.

Figure T23.2 Histogram of FL3-H with Beads Gate Applied
The histogram shows the five fluorescent peaks, plus a "blank", of the calibration particles. We will now proceed to delineate the peaks by setting individual markers on each peak.
7. Select the Gating→Create Gates→Create Marker command.
8. Place the cursor inside the histogram and to the left of the brightest peak.
9. Press and hold the left mouse button down and drag the mouse to the right side of the peak.
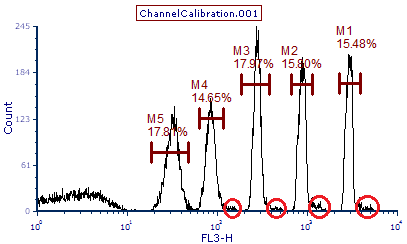
10. Release the mouse button when you are on the right side of the brightest peak. Take care to avoid the "tail" which represents the doublets, indicated by the red circle in Figure T23.3.
You can move and resize the marker freely once it has been created by selecting the marker and moving either the ends of the marker or the whole marker. For more information on resizing markers please refer to the tutorial section explaining Marker to Gate Linking.
Repeat steps 7 through 9 for each of the other four peaks, moving from the brightest to the dimmest peak, excluding the lowest peak associated with the "blank" beads. You should now have five markers, one for each fluorescent peak, as shown in Figure T23.3.

Figure T23.3 Markers M1 through M5 for the five Fluorescent Peaks (red circles indicate doublets)
Note: The default setting for FCS Express is to use channel calibration on the axes. Therefore, before we set up the channel calibration, it is important to set the histogram, showing the beads, to not use channel calibration, since that is our original reference.
11. Right-click on the histogram showing the calibration beads in the FL3 channel to bring up the associated pop-up menu.
12. Select Format from the pop-up menu.
The Formatting dialog for the histogram appears.
13. Select Histogram→Histogram Specific Options from the categories listed on the left of the Formatting dialog.
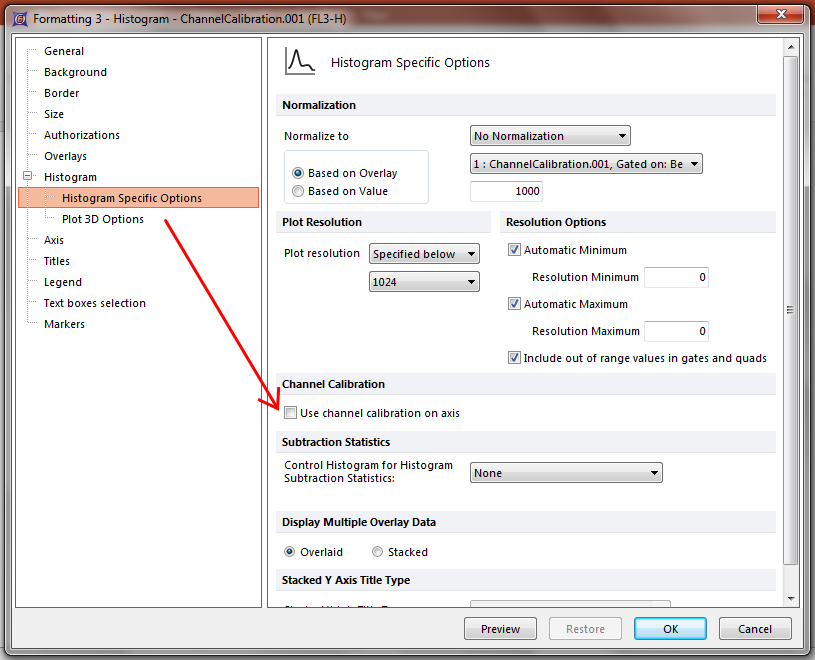
The Histogram Specific Options category of the Formatting dialog will appear (Figure T23.4).
14. Unselect the Use channel calibration on axis option, indicated by the cursor (Figure T23.4).
15. Click OK.

Figure T23.4 Formatting Dialog -- Unselecting Use channel calibration on axis
In the next section, we will set up the channel calibration tool.
