Color Levels
Color Level options for Spectrum Plots are enabled in Color on Density Display Mode only.
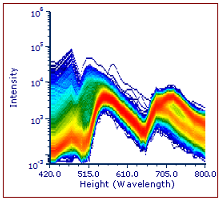
Color Levels for Spectrum Plots can be formatted in the same manner as for 2D-Density Plot Color Levels. Below is an example of a plot with customized color levels (Figure 8.93). Please also see the Formatting a Spectrum Plot chapter for additional details and examples.

Figure 8.93 - The two Spectrum Plots in the center of the picture have customized Color Levels.
