Dot and Color Dot Plot Overlays
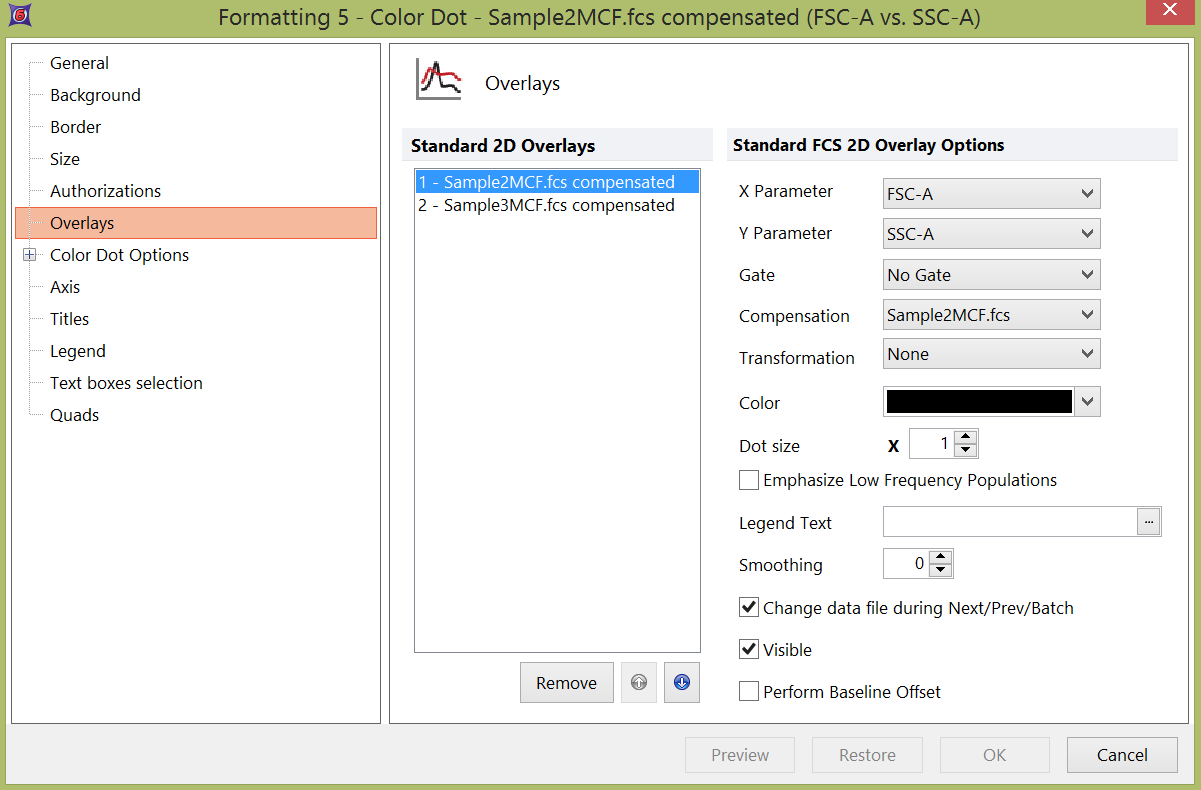
For Dot plots and Color dot plots the following overlay options are available (Figure 8.96).
Option |
Explanation |
|---|---|
X Parameter |
Change the parameter displayed on the X axis. |
Y Parameter |
Change the parameter displayed on the Y axis. |
Gate |
If gates are defined, select the gate that will be used to limit the data that is displayed on the 2D plot. |
Compensation |
If compensation definitions are set, select the definition to use when compensating the data in the overlay. |
Transformation |
If transformations are defined, select the transformation to use when displaying the data in the overlay. |
Color |
The color that the overlay will be drawn in (used for dot plots and color dot plots). The default overlay colors can be set on the 2D plot preferences page of the FCS express User Options Dialog. |
Dot Size |
FCS Express automatically calculates the dot size based upon the height and width of your plot. By changing this setting, you can force the dot size to be larger or smaller than what FCS Express calculates by the factor chosen in the spin box. Note: If you are using several overlays on color dot plots, and you want the overlays to have different dot sizes, then the plot must be set with Dither turned off. |
If the % gated for a given gate is < 2%, the dot size for those gated events will increase. Only available for Dot plots displaying gate colors and Color Dot plots. |
|
Legend Text |
The text that will appear in the legend beside the symbol for the overlay. Free text can be inserted. If this field is blank the file name of the overlay will appear. A dropdown menu with additional pre-customized legend content is accessible by pressing the ellipsis button next to the legend text. Possible choices are: oKeyword. This can be used to insert keywords from the header of the data file. oGate. This can be used to display the current gate applied to the overlay. oTube Number. This can be used to display the Tube Number of the overlay when a Panel is active. oTube Name. This can be used to display the Tube Name of the overlay when a Panel is active. The above mentioned Legend options apply only to Dot Plots, Color Dot Plots, Histograms and Spectrum Plots. |
Smoothing |
Set the degree of smoothing for the presentation of your data. |
Change data file during Next/Prev/Batch |
If this option is checked, the data file for this overlay will change when doing batch processing, or selecting Previous File or Next File. This option is usually only disabled for control histograms, where you have multiple overlays, and want the control to stay the same all of the time. |
Visible |
Controls whether or not to display this overlay on the 2D plot. |
Perform Baseline Offset |
If the value of the cell is zero, a random offset will be added so that the dot appears off the axis. This will not affect the statistics. This option is typically used when analyzing LMD files from Beckman Coulter. |

Figure 8.96 Formatting Overlays Dialog for 2D Dot Plots
