2D Plot Statistic Token Options
Statistic token properties vary depending on whether the Statistic token uses a Plot or a Data File as Data Source.
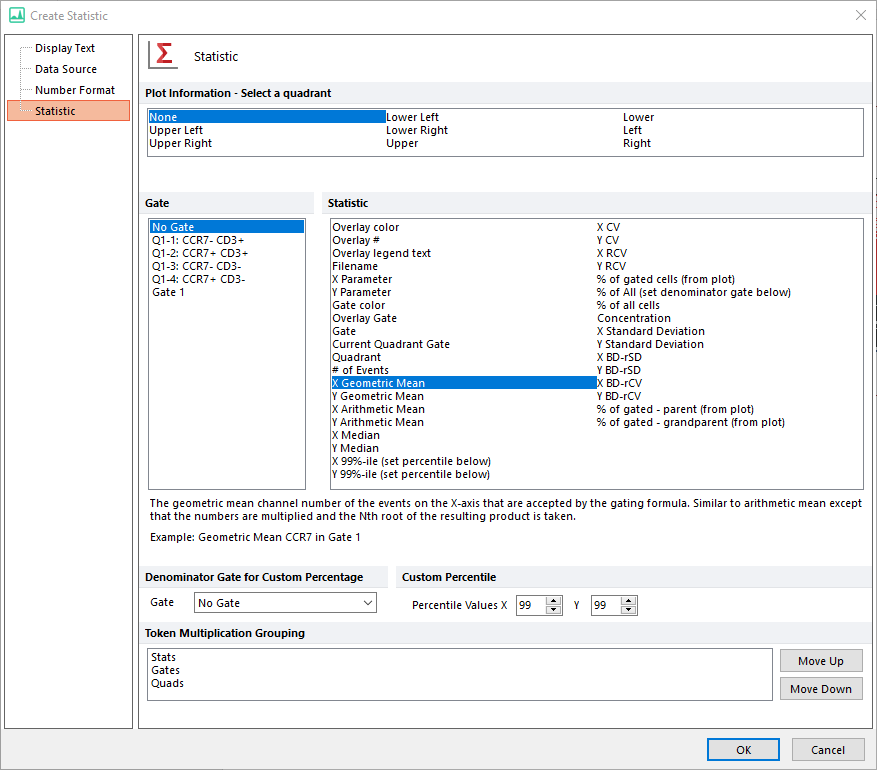
If a 2D Plot is chosen as the Data Source of a Statistic Token, the Create Statistic dialog will open (Figure 12.13).

Figure 12.13 The Create Statistic dialog
The Create Statistic dialog for 2D Plot allows you to set the following Statistic token properties (see categories on the left ion the screenshot above):
•Plot Information - Select a quadrant
This section is available only if a Quadrant Set is visible on the plot.
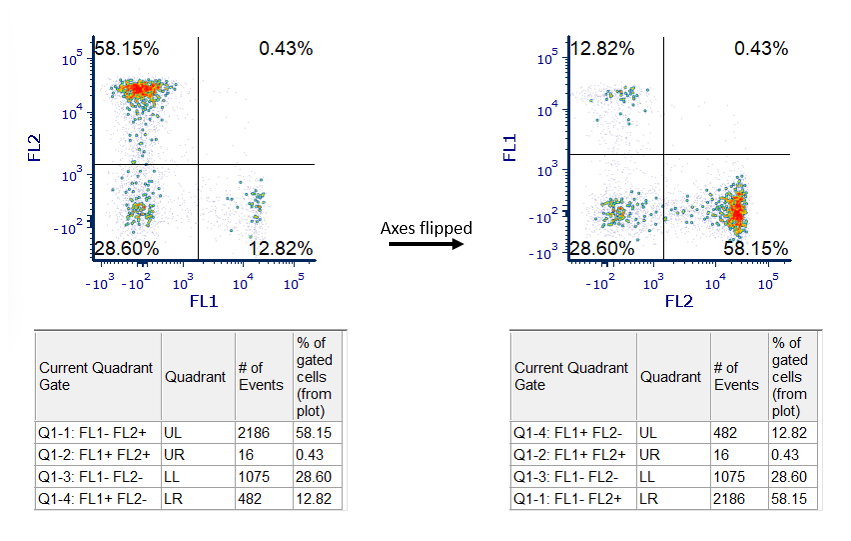
Select one or more quadrants to use as a basis for your statistic. The default selection is None which will use all events on the plot.Please note that quadrants selected using this list are tied to their position on the plot, not to the parameters currently displayed in it. E.g. if the UL quadrant is selected, and said quadrant currently correspond to FL1-FL2+ (Figure 12.14 below; left pane), the statistic token created with this settings will refer to the UL quadrants even if the plot axes a flipped. This means that if axes are flipped, the UL quadrant will then refer to the FL1+F2- population (Figure below; right pane).

Figure 12.14 Note quadrant regions (e.g. UL, UR,...) refers to different populations if axes are flipped. Please compare left and right panes in the picture.
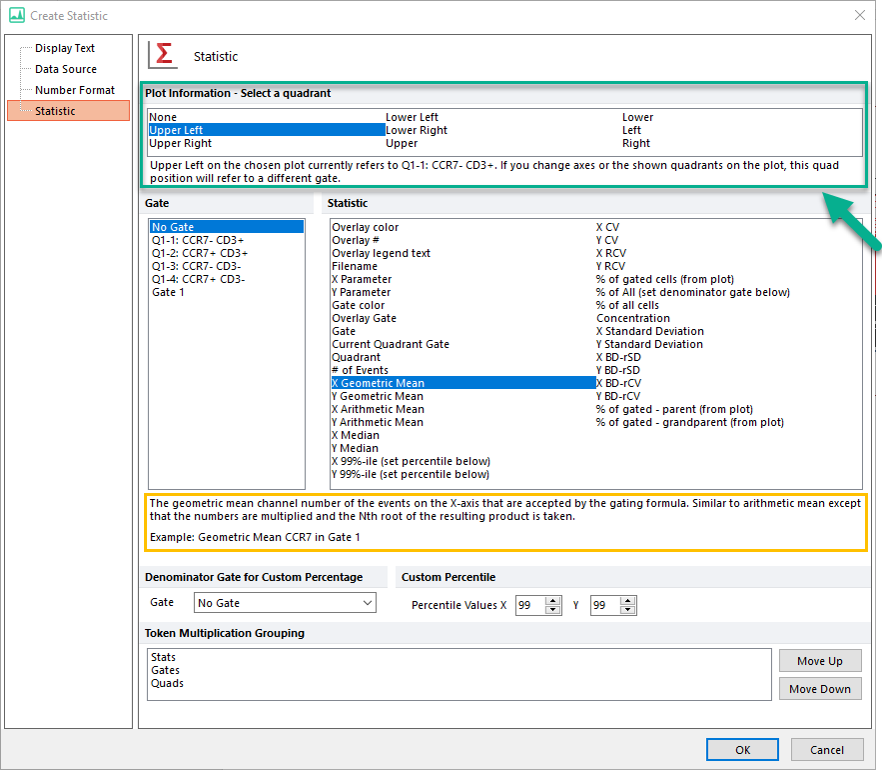
To make the behavior described above more evident, the first time a quadrant is selected in this section, a warning message will be reported in the Create Statistic dialog, right below the Plot Information - Select a quadrant section (Figure 12.15; green rectangle and green arrow). Please note that the warning message is not automatically displayed if multiple quadrants are selected. However, the behavior will still be the one described above.

Figure 12.15 Please note the warning message (green arrow)
•Gate
Select one or more gates to use as a basis for your statistic. The default is No Gate which will use all events on the plot.
Note: Since FCS Express version 7.20, all shown gates (i.e those gates whose outline is displayed on the plot of interest) will appear at the top of the list.
•Statistic
Select the statistic(s) to display. Multiple statistics may be selected and inserted together by holding down the control key while multiple selecting. When a statistic is selected, a description of it will be shown at the bottom of the Statistics section (an example is highlighted in the yellow rectangle in the Figure above). Note, If multiple statistics are selected, only the description of the first statistic of the list will be shown. See 2D Plot Statistics for descriptions of each specific statistic.
•Denominator Gate for Custom Percentage
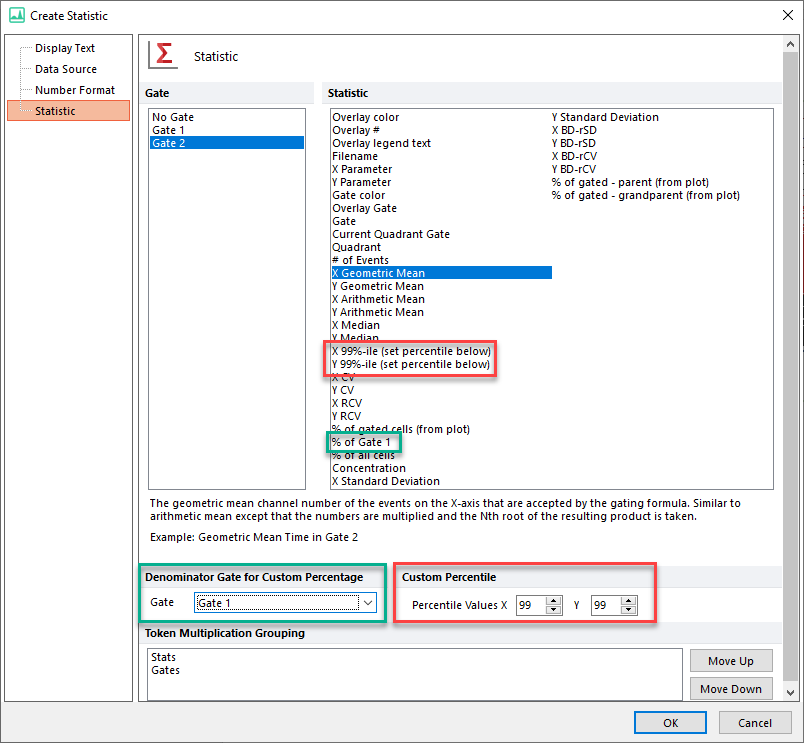
Select the gate to be used as denominator for calculating the "% of All (set denominator gate below) " (green rectangles in Figure 12.16 below)). Note that the name of the statistics in the Statistics section, will update according to the gate name defined. For example, in the figure below, "Gate 1" is defined as Denominator Gate for Custom Percentage. The corresponding statistics in the Statistics section is named "% of Gate 1" accordingly.
•Custom Percentile
Allow to customize the percentile value for the X and/or the Y "99%-ile (set percentile below)" tokens (red rectangles in above figure). Values allowed goes from 1 to 99. Note that the name of the statistics in the Statistics section, will update according to the percentile defined. For example, if "98" is defined as Percentile Value for the X %-ile, the name of the statistic in the Statistics section will automatically update to "X 98%-ile (set percentile below)". Decimals are allowed when setting the statistic to a specific percentile.
•Token Multiplication Grouping
Select the grouping priority for your statistics, which will be used to group the output by statistic, gate, and/or quadrant when multiple gates and/or quadrants are selected. The default grouping priority is Stats > Gates > Quads. The default grouping priority will group each statistic together in a contiguous block. Within each block the output will be grouped by gate, then by quadrant. The grouping priority can be changed by moving a selected grouping option with the Move Up or Move Down buttons, with the highest priority appearing at the top of the Token Multiplication Grouping selection box.

Figure 12.16 Statistic Options - 2D Plot as Data Source.
Note: Decimal places are allowed in Custom Percentiles.
--
Note: It is also possible to insert or edit a Statistic token with an .fcs file as a Data Source, though if the desired file is showing on your layout, it is preferable to use a Plot as the Data Source as described above. Please refer to the Data File Statistic Token Options chapter for more details on the available Statistics properties when an .fcs file is used as Data Source for a Statistic token.
