2D Plot Statistics Options
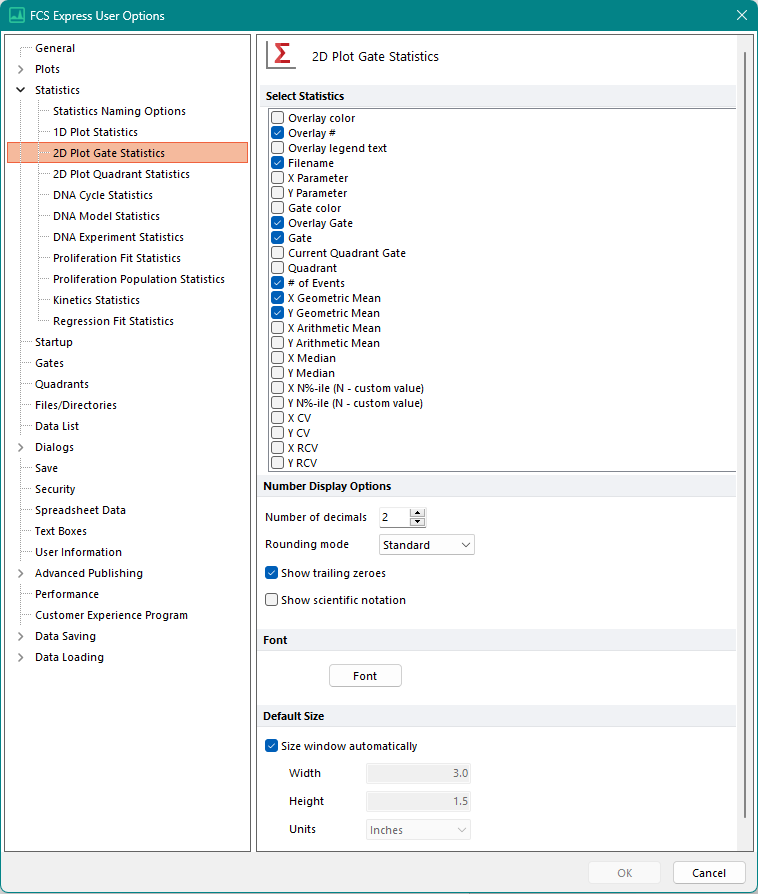
The 2D Plot Statistics options (Figure 20.21) determine the default visibility and display for 2D plot statistics.

Figure 20.20 2D Plot Statistics Options
The options are explained in the table below.
Option |
Explanation |
|---|---|
Select Statistics |
The check box determines whether or not statistic items are displayed when a Gate Statistics window is first opened. The individual statistics items are explained in the statistics section of the chapter on analysis of FCS data. |
Number Display Options |
•Number of decimals iindicates the number of decimal places listed to the right of any decimal point. •Rounding mode indicates the method for rounding the last digit. Choose between Standard, Down, Up, and Truncate. oStandard rounds values half way from zero (i.e. 85.55 rounds to 85.60). oDown rounds values always down (i.e. 85.54 rounds to 85.50). oUp rounds values always up (i.e. 85.55 rounds to 85.60). oTruncate rounds values always towards zero (i.e. 85.55 rounds to 85.50). •Show trailing zeroes, if checked, shows the specified number of decimals even if the terminal digits are zeroes. •Show scientific notation, if checked, shows the number in standard form or standard index form: m x 10n, where m is any real number times ten raised to the n power. |
Font |
The default font to use when displaying the statistics. |
Default Size |
Sets the default size of the statistics window. If Size window automatically is checked, size will automatically adjust if data is added that extends beyond the window borders. |
