Analyzing Files from the Data List with Spreadsheets
Spreadsheets may be used to quickly analyze and compare statistics for many data files from the data list without opening additional plots or creating a batch process.
After data files have been loaded into the Data List, the data files may individually or multiple selected in the data list, dragged and dropped onto a spreadsheet, and the information or statistics to display will be inserted into the spreadsheet cells. If plots exist on the layout you may choose to derive statistics from gates and as gates are adjusted the values in the spreadsheet will update in real time.
To analyze files from the data list in a Spreadsheet:
1. Create a Spreadsheet in the layout.
2. Open the Data List. (Figure 5.202)
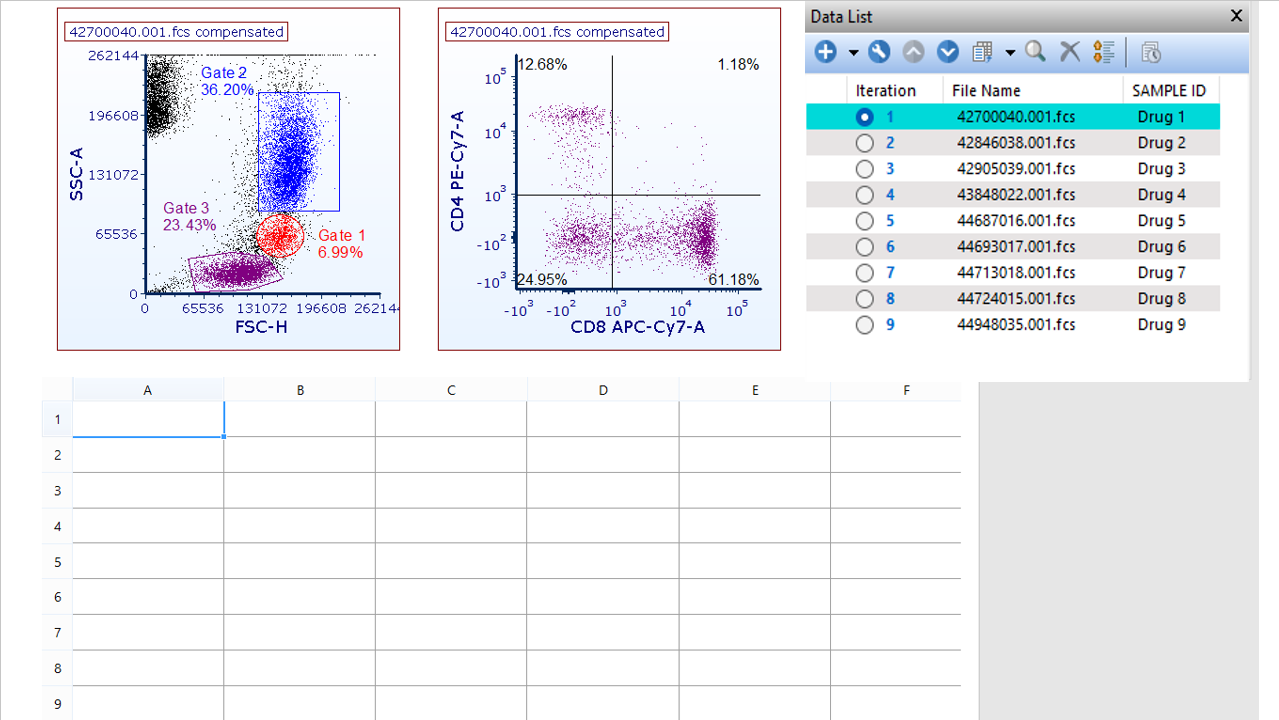
Figure 5.200 - A layout with spreadsheet created and data list opened.
3. Multiple select data files from the data list.
4. Drag and drop data files from the data list into the first cell in the spreadsheet that you would like statistics to appear (Figure 5.203).
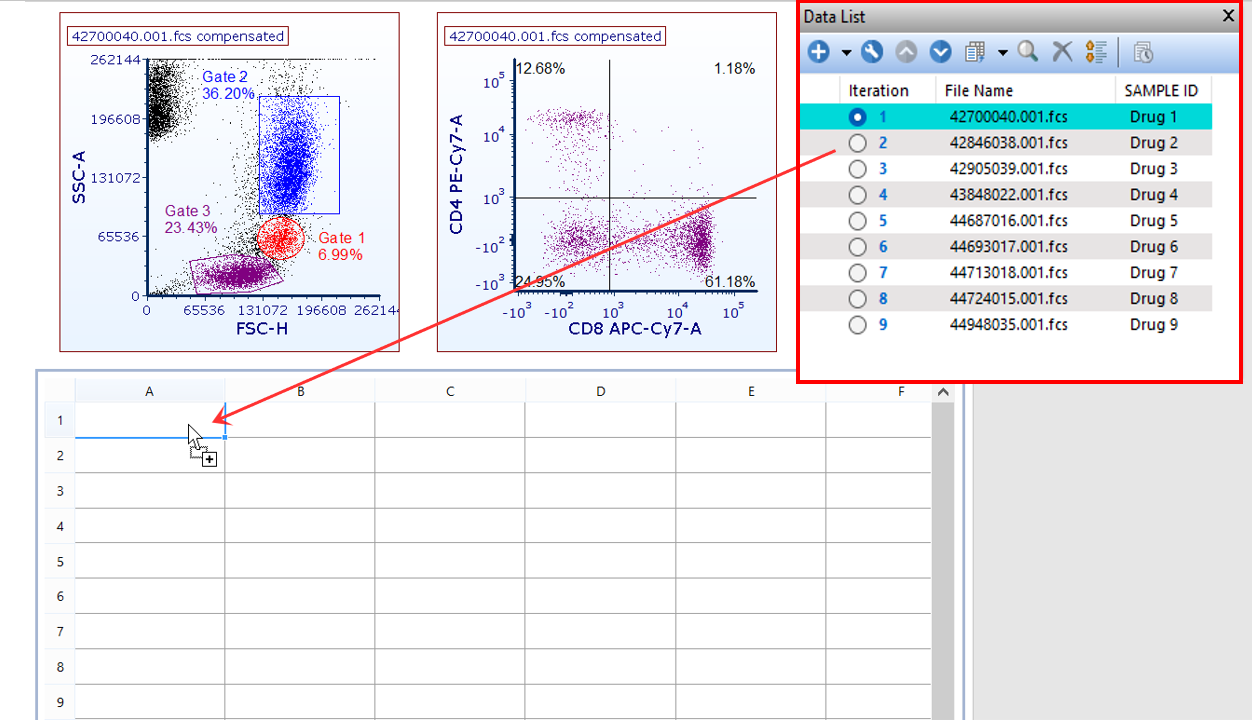
Figure 5.201 - Dragging and dropping data files from the data list into a cell in the spreadsheet.
5. Select Statistic Token or Keyword Token in the Paste Special dialog. In this example, Statistic Token has been selected.
Within the Create Statistic dialog (Figure 5.204):
6. Select the appropriate parameter for the statistic from the Parameter list.
Note - a parameter must be selected regardless of the statistic you choose to insert
7. Select a compensation or choose Default or None from the Compensation drop down.
Note: by setting Default from the Compensation drop down, the default option for compensation specified in the User Options will be used.
8.Select a transformation of interest or choose None from the Transformation drop down.
9. Select a gate from the Gate list if needed.
10. Select one or multiple statistics from the Statistic list.
Please also see the section on using Token Multiplication grouping to insert and select multiple gates, statistics, markers, and quadrants at the same time.
NOTE: The values present in a Spreadsheet for data derived from the data list will reflect the values associated with the data file/iteration and will update in real time. However, in some situations a "fixed" or static value from a particular data file(s)/iteration(s) may be useful to insert in a Spreadsheet. For instance, if you would like to derive the mean from an Isotype control or any other statistic when batch processing. When the having a static or fixed value from a data file or iteration is necessary, the statistics added to the spreadsheet can be made independent from the iteration selected. In other words, the statistics will not change while batch processing or changing through different iterations.
To "fix" a value in the spreadsheet to prevent allowing the value associated with the data file/iteration to change click on the Data Source category on the left of the Create Statistic window after dragging and dropping a data file from the data list into the spreadsheet and uncheck the Allow the Data file of this token to change when running Next/Prev/Batch Processing option as seen in the image below. This option is always available for statistics added by dragging and dropping files from the Data List to the spreadsheet, and can be accessed by right clicking on a spreadsheet cell and by selecting Format Token (the Edit Keyword or the Edit Statistic dialog will open and the Data Source category will be available on the left). However, by unchecking the option during the initial drag and drop action (i.e. before Step 11 below), the option will apply to all of the data files/iterations at once.
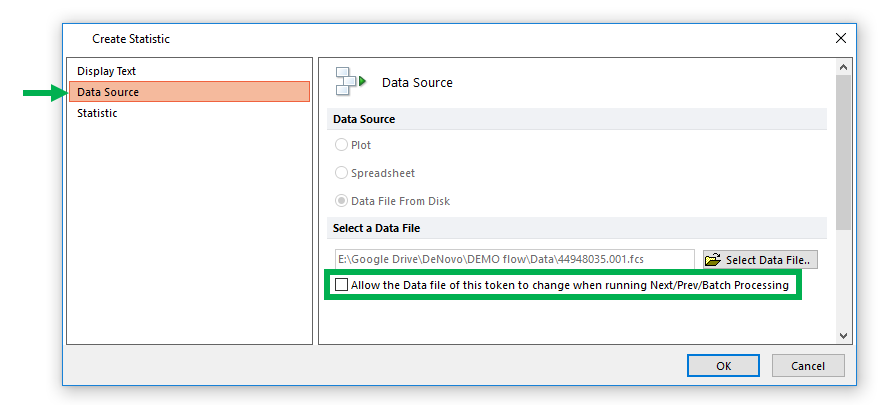
Statistics within the spreadsheet can be made independent from the currently loaded iteration by unchecking the "Allow the Data file of this token to change when running Next/Prev/Batch Processing" option.
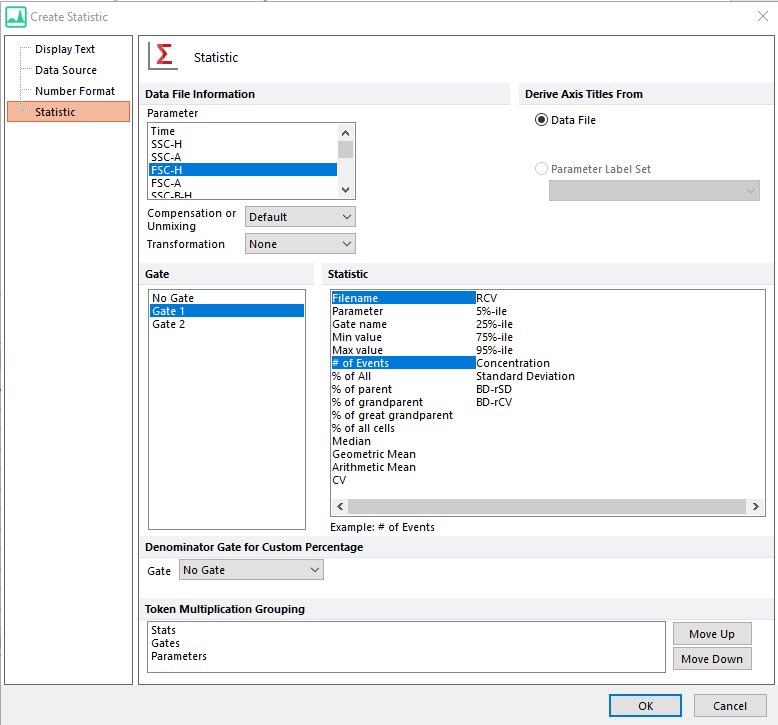
Figure 5.202 - Selecting the parameter, compensation, and statistics to insert in the spreadsheet cells.
11.Click OK.
The statistics for all of the data files you selected from the data list will appear in the spreadsheet and will update in real-time as gates are adjusted (Figure 5.205).
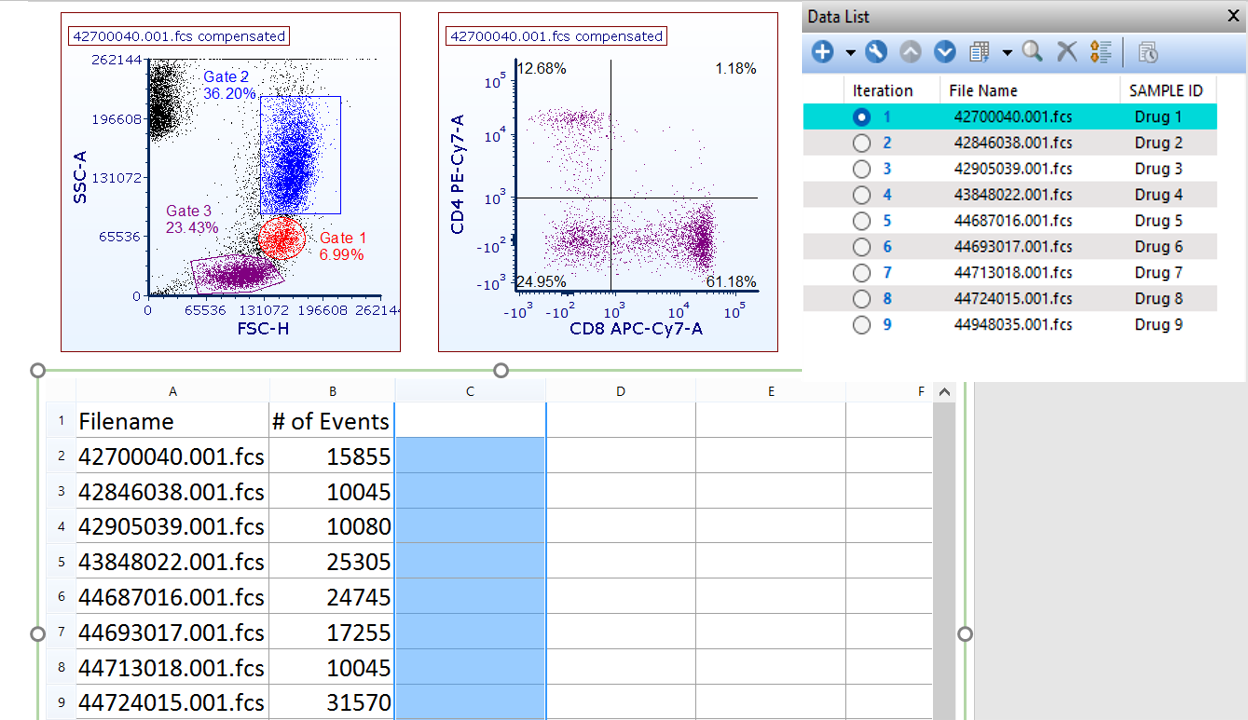
Figure 5.203 - Statistics for all of the data files selected will appear in the spreadsheet.
If additional statistics or statistics from different parameters are needed repeat the steps above. In the example below additional columns were added for gated statistics (Gate 1) and statistics from different parameters (Median CD8) (Figure 5.206).
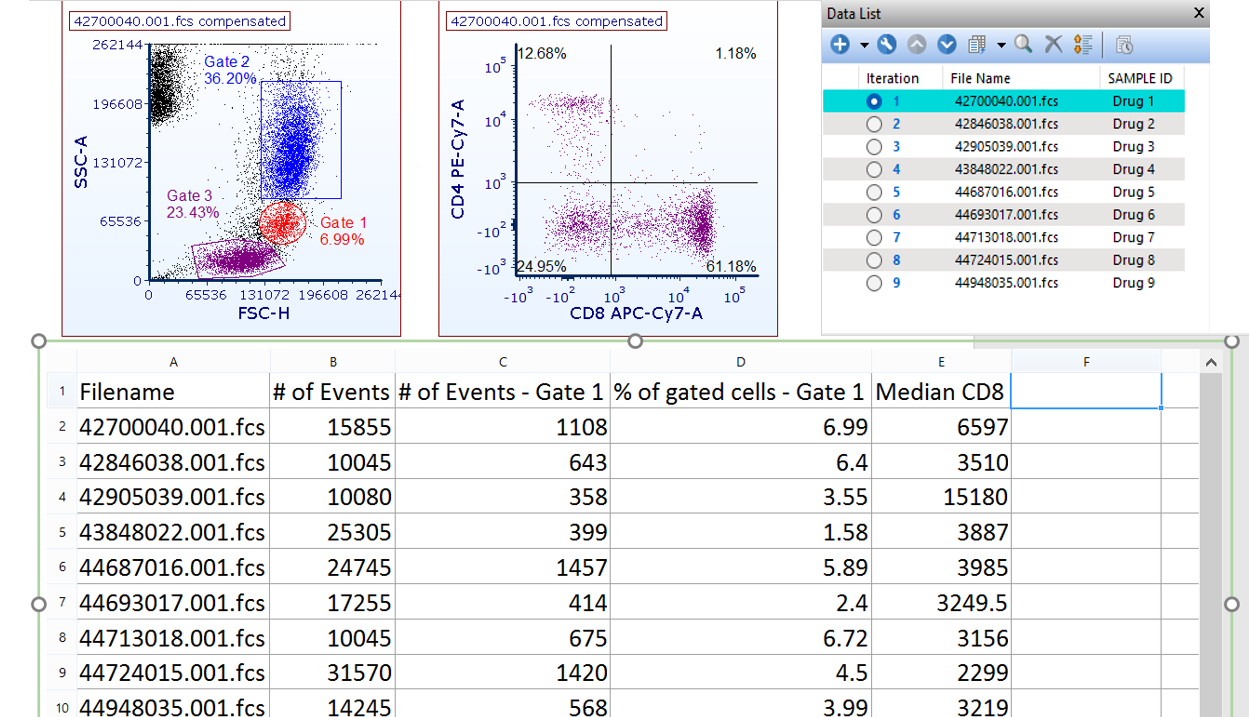
Figure 5.204 - Spreadsheet displaying statistics from 9 data files from different gated populations and parameters. Statistics will update in real time as gates are adjusted.
