Batch Processing Proliferation Data
In the previous sections, we have inserted proliferation plots, optimized the proliferation fit, formatted the proliferation plot, and inserted proliferation fit and population statistics. We will use the "Proliferation Tutorial for Batch Processing.fey" layout, which incorporates all of the steps from the previous three sections to allow us focus on the batch process.
1. Open the "Proliferation Tutorial for Batch Process.fey" layout from the Proliferation Tutorial subfolder in the Tutorial Sample Data folder.
2. Click on the Batch tab→Batch Processing group→Batch Actions command.
The Batch Actions window will open.
3. Click on Save to PowerPoint in the Add Action category.
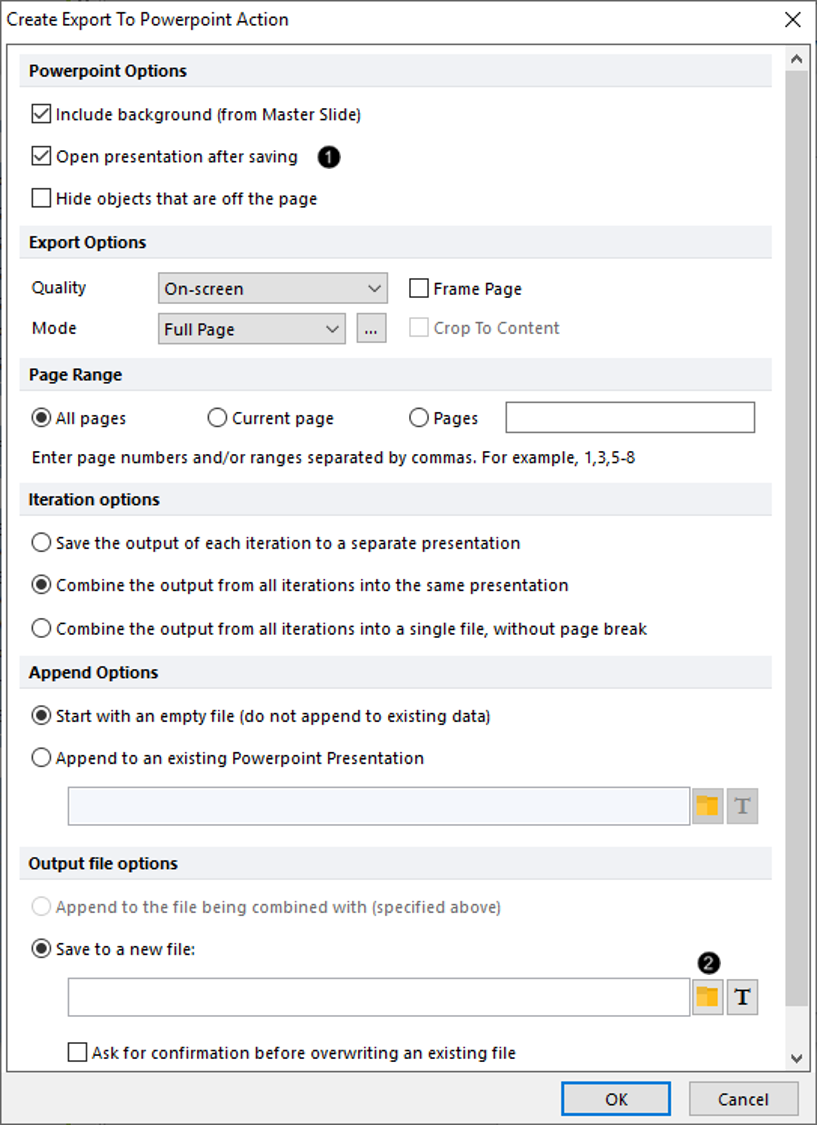
The Create Export To PowerPoint Action dialog will open (Figure T22.23).
4. Check box next to Open presentation after saving under PowerPoint Options (Figure T22.23, ![]() ).
).
5. Click the folder icon ![]() next to the edit field for Save to a new file: under the Output file options category (Figure T22.23,
next to the edit field for Save to a new file: under the Output file options category (Figure T22.23, ![]() ).
).

Figure T22.23 Editing the Options for Create Export to Powerpoint Action
6. Choose a location and a file name for the PowerPoint file to be created.
7. Click Save to close Save As dialog.
8. Click OK to close the Create Export to PowerPoint Action dialog.
9. Click the Export to Excel (Column Mode) in the Add Report category in the Batch Actions window.
The Excel (Column Mode) Options dialog will open, which will be similar, but not identical, to Figure T22.23.
10. Click the folder icon ![]() next to the edit field for Save to a new file: under the Output file options category.
next to the edit field for Save to a new file: under the Output file options category.
11. Choose a location and a file name for the Excel file that will be created.
12. Click Save to close Save As dialog.
13. Click OK to close Export (Column Mode) Options dialog.
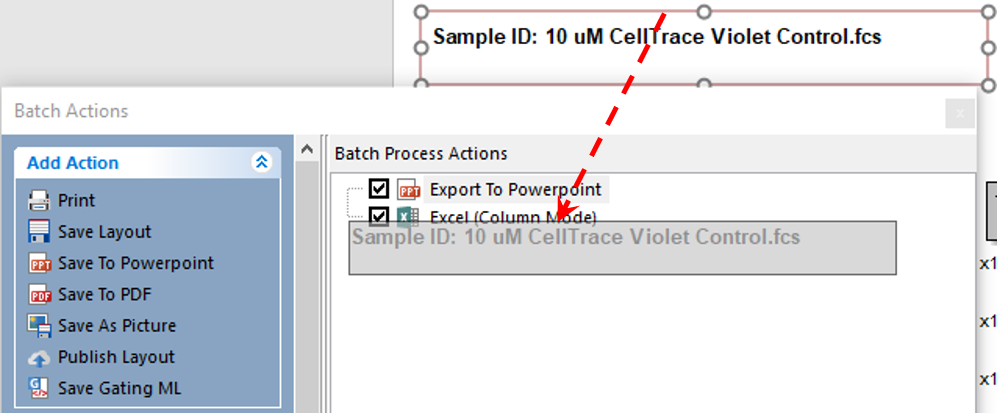
14. Drag the text box containing the Sample ID from the top of the Gating page by clicking its border and drop it on top of the Excel (Column Mode) text in the Batch Process Actions window (Figure T22.24).

Figure T22.24 Dragging and Dropping Text Box with Sample ID to Excel (Column Mode) Batch Action
15. Select all the statistics in the Proliferation Fit Statistics Table, so they appear highlighted in blue. Click inside table and key CTRL+A.
16. Click a single blue-highlighted cell of statistics table; drag and drop on top of the Excel (Column Mode) icon in the Batch Process Actions window (Fig. T22.25).

Figure T22.25 Dragging and Dropping the Proliferation Fit Statistics Table to the Excel (Column Mode) Batch Action
Dragging and dropping the sample ID text box and table data to the Batch Process Actions window→Excel (Column Mode) icon has added the sample ID and all of the statistics from the table to the excel report.
17. Click the Batch tab→Batch Processing→Run button to begin the batch process.
The batch process will proceed through the four data files in the data list and generate an 8-slide PowerPoint file, which will include two slides per sample, and an Excel document, which will have four rows of data - one row with columns showing the Sample ID and statistics per sample.
