Histogram Statistic Token Options
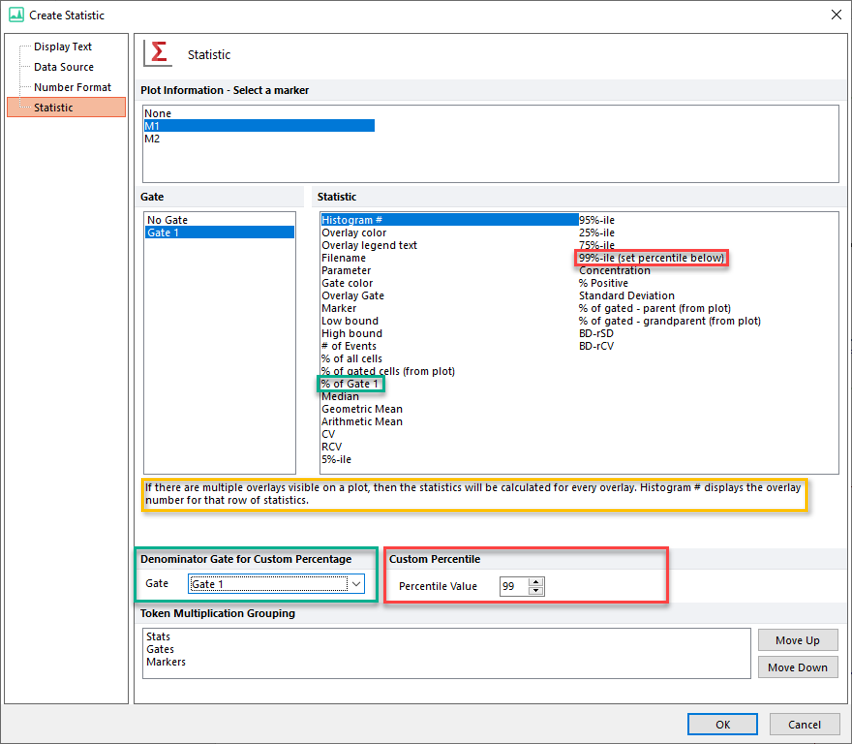
If a Histogram is the Plot type chosen for a Data Source of a Statistic Token, the following properties can be set (Figure 12.17).

Figure 12.17 Statistic Options - Histogram as Data Source.
Note: Decimal places are allowed in Custom Percentile.
•Plot Information - Select a marker
Select one or more markers to use as a basis for your statistic. The default selection is None which will use all events on the plot.
•Gate
Select one or more gates to use as a basis for your statistic. The default is No Gate which will use all events on the plot.
•Statistic
Select the statistic to display. When a statistic is selected, a description of it will be shown at the bottom of the Statistics section (an example is highlighted in the yellow rectangle in the Figure above). Note, If multiple statistics are selected, only the description of the first statistic of the list will be shown. See Histogram Statistics for descriptions of each Statistic.
•Denominator Gate for Custom Percentage
Select the gate to be used as denominator for calculating the "% of All (set denominator gate below) " (green rectangles in above figure). Note that the name of the statistics in the Statistics section, will update according to the gate name defined. For example, in the figure above, "Gate 1" is defined as Denominator Gate for Custom Percentage. The corresponding statistic in the Statistics section is named "% of Gate 1" accordingly.
•Custom Percentile
Allow to customize the percentile value for the "99%-ile (set percentile below)" token (red rectangles in above figure). Values allowed goes from 1 to 99. Note that the name of the statistics in the Statistics section, will update according to the percentile defined. For example, if "98" is defined as Percentile Value, the name of the statistic in the Statistics section will automatically update to "98%-ile (set percentile below)". Decimals are allowed when setting the statistic to a specific percentile.
•Token Multiplication Grouping
Select the grouping priority for your statistics, which will be used to group the output by statistic, gate, and/or marker when multiple gates and/or markers are selected. The default grouping priority is Stats > Gates > Markers. The default grouping priority will group each statistic together in a contiguous block. Within each block the output will be grouped by gate, then by marker. The grouping priority can be changed by moving a selected grouping option with the Move Up or Move Down buttons, with the highest priority appearing at the top of the Token Multiplication Grouping selection box. Please see the detailed overview of token multiplication grouping for additional details.
