Axis Min/Max
It is possible to customize plot axes Minimum and/or Maximum in two ways:
•through the Min/Max option in the Axis Formatting dialog,
•by right-clicking on the plot and selecting Magnify Axes.
Depending on the plot type, the Resolution and/or the Range can be magnified using the two methods above.
To Magnify Axes on a plot via right-click:
•Right-click on the plot and select Magnify Axes. Note that for plot types allowing both Range and Resolution Magnification, a drop-down will open allowing to chose which of the two to magnify.
•Press and hold the mouse button down where you want one corner of the magnification "box" to be.
•Drag the cursor to where you want the other corner of the magnification "box" to be.
•Release the mouse button.
To Unmagnify Axes on a plot via right-click:
•Right-click on the plot and select Unmagnify Axes. Note that for plot types allowing both Range and Resolution Magnification, a drop-down will open allowing to chose which of the two to unmagnify.
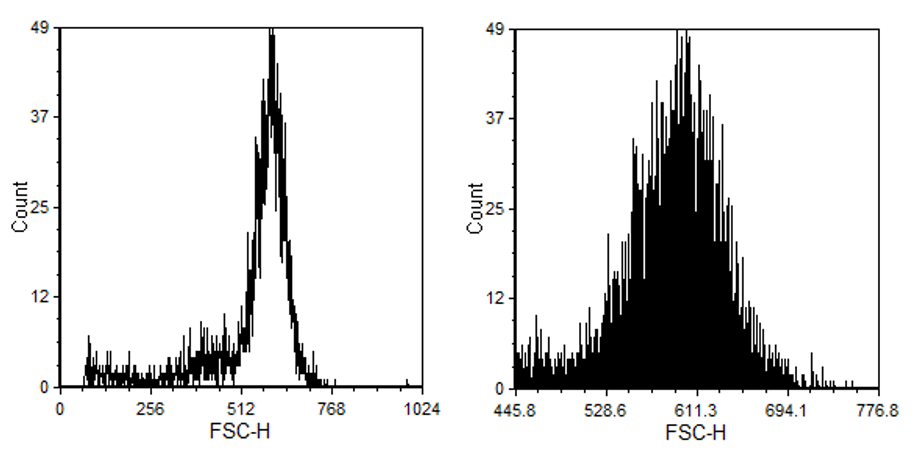
An example of Axis Magnification for histogram is shown in Figure 5.140.

Figure 5.140 An Example of Axis Magnification on Histogram (before, on the left and after, on the right).
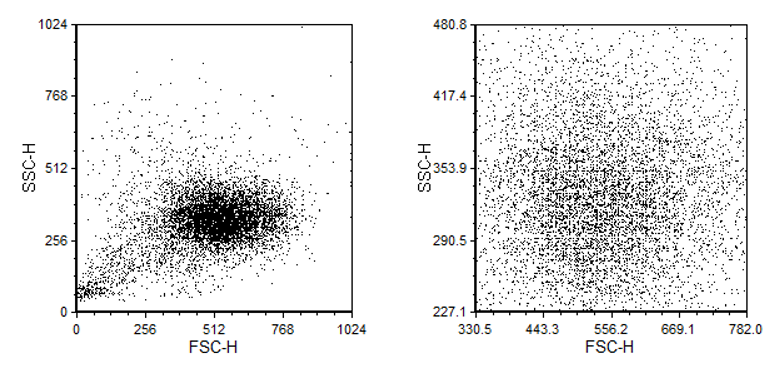
An example of Axis Magnification for 2D plot is shown in Figure 5.141.

Figure 5.141 An Example of Axis Magnification on 2D plot(before, on the left and after, on the right).
