Pie Charts
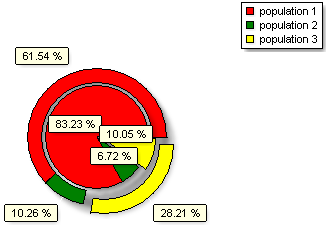
Pie charts are a convenient means for visualizing how several statistics relate to one another and combine to form a conceptual whole (e.g., Figure 5.216).
Pie Charts can be inserted anywhere on your layout, and can be populated via drag-and-drop or from Spreadsheets containing statistical tokens or freetext. They are also fully formattable.
The appearance of Pie Charts in FCS Express is customizable via special formatting options.

Figure 5.214 Pie Chart in FCS Express
