Populating Pie Charts by Drag-and-Drop
Pie Charts are easy to populate through the drag-and-drop functionality in FCS Express. You can drag plots or gates, statistical tokens, or free text to create or replace sectors (slices) on a blank Pie Chart that has already been inserted on your layout.
When populating a previously blank Pie Chart by drag-and-drop, the following actions are available:
•Insert a new statistic or value to be plotted as a slice in the pie chart.
•Replace the value of an existing slice in pie chart with a new value.
See the figures and steps below to learn how to populate Pie Charts by drag-and-drop.
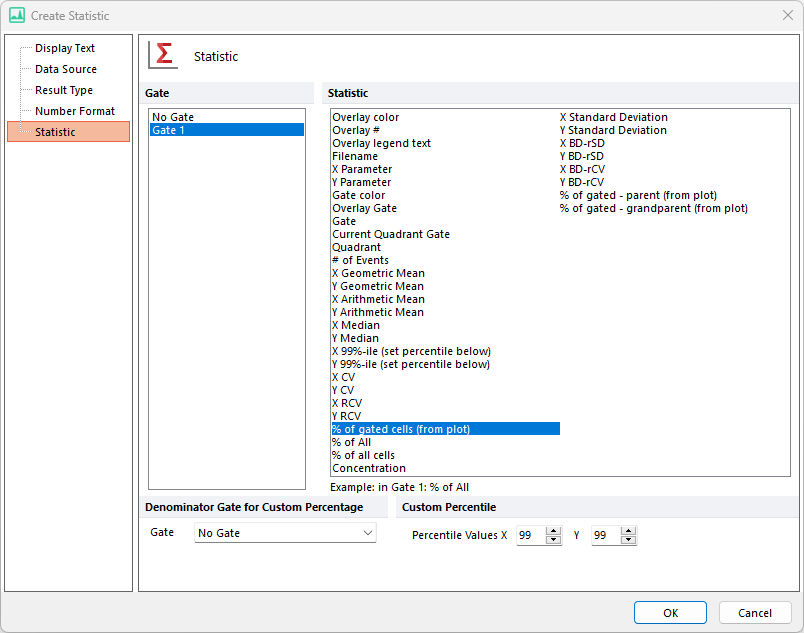
After inserting a blank Pie Chart, dragging and dropping gates onto it will cause the Edit Statistic dialog to appear. The specific statistic relating to the gate can be chosen for plotting (e.g., "% of Gated Cells" in Fig. 5.216).

Figure 5.214 Edit Statistic dialog appearing after dragging a gate to a Pie Chart
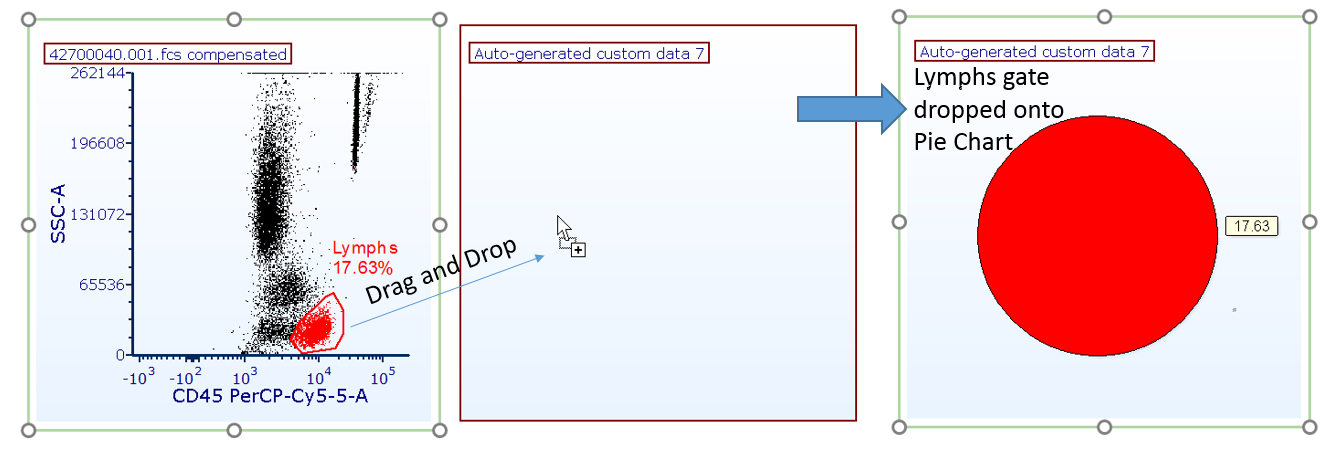
The result of dragging and dropping a gate to a Pie Chart and choosing the desired statistic in the Edit Statistic dialog is shown in Fig. 5.217 below.

Figure 5.215 Dragging a gate to a Pie Chart to add a sector (slice)
Statistical tokens or freetext from default statistics windows or text boxes on your layout can also be dragged directly to Pie Chart. The data value must be dropped on the plot outside of the existing pie area (if dropped on the pie area the current value representing the slice will be replaced with the dropped value). In this case, the Edit Statistic dialog will not appear. In the example below, the selected "Gate 1, % of gated cells" statistic is dragged to an empty space on the Pie Chart, in order to add a new sector (slice) (Fig. 5.218).

Figure 5.216 Dragging and dropping a statistic token to the Pie Chart
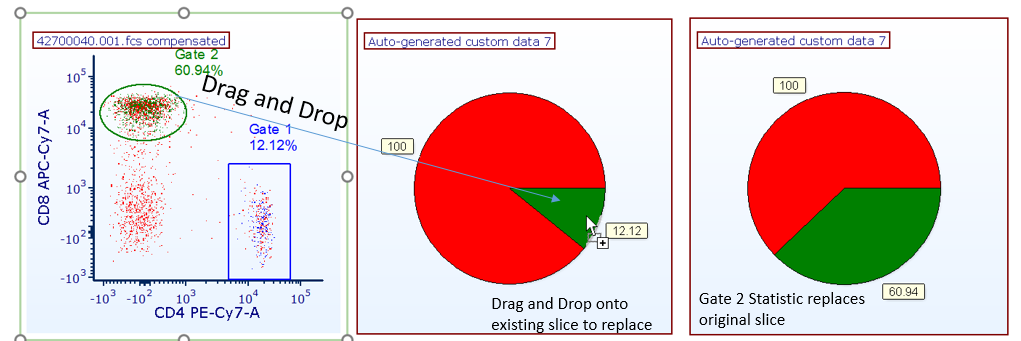
Dragging a plot, gate, or statistic onto an existing sector (slice) will replace it with the desired statistic, as shown below (Fig. 5.219).

Figure 5.217 Dragging and dropping a gate to replace an existing sector (slice) on a Pie Chart
