Rectangular and Floating Quadrants
In the course of this example, we will:
•Learn how to create rectangular quadrants and move them.
•Learn how to create floating quadrants and move them.
To place a rectangular quadrant and move it:
1.Select File tab→Open.
2.Open the layout QuadTut.fey found in the Tutorial Sample Data archive.
Two density dot plots now appear on the layout.
3.Select the Gating tab→Create Gates group→Quadrants  command.
4.Click in the middle of the left density dot plot.
The Create New Quadrants dialog will open. The radial button called Create new quadrants named is selected (Figure T6.2). In the window, you may define:
•Whether to create the quadrant hierarchically (the default parent gate is set to be the gate applied to the base overlay of the plot; but can be customized using the Parent Gate drop-down menu) or not (i.e. the quadrant will be created under the root of the gate hierarchy (i.e. usually named No Gate)).
•Whether to replace existing Quadrants. This option will only be available if there is a set of quadrants already in the layout.
•The Prefix, Current X and Current Y for naming purposes. This option is only available if a new quadrant is created. Below the naming options an example is created to show you a preview of the resulting naming.
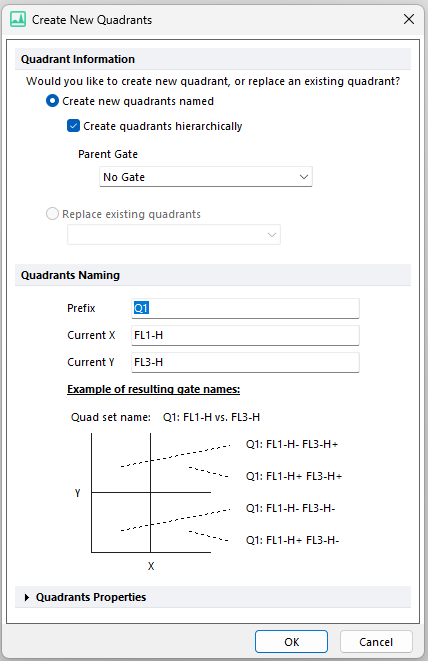
Figure T6.2 Created New Quadrants Dialog
5.Click OK
A rectangular or "standard" set of quadrants now appears on the plot with the center of the quadrant located where you clicked in the plot. Note that the quadrant set is selected, as indicated by the rectangular symbol in the center of the quadrant where the lines cross (the central vertex), indicated by the cursor in Figure T6.3. Also note the quadrants' percentages are placed automatically in the corners of the plot (Figure T6.3).
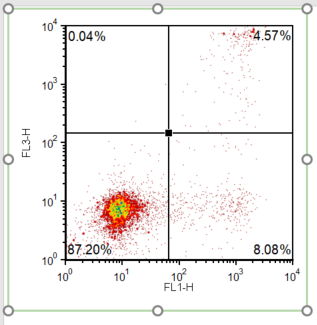
Figure T6.3 Plot with Quadrants
If the quadrants central vertex is currently selected, then skip to Step 6.
6.Click in the middle of the quadrant at the central vertex to select the quadrant (T6.3).
7.Hover the mouse over the central vertex of the quadrant; the cursor should change to a four-headed arrow.
We now will move the position of the central vertex of the quadrant to redefine the quadrant.
8.Press the left mouse button when the cursor is a four-headed arrow.
9.Continue to hold the left mouse button and move the central vertex to the desired location.
10.Release the mouse when the quadrants properly define the three populations in the plot.
Notice that when you move the central vertex, the percentages of the quadrants change accordingly. The final plot should resemble Figure T6.4.
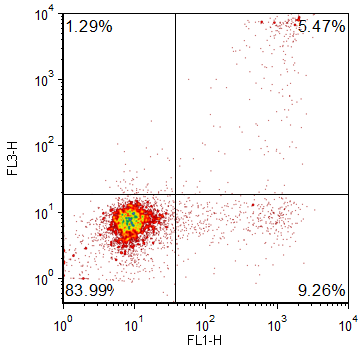
Figure T6.4 Redefined Quadrants
We now will insert quadrants on the right plot. In this case, if we try to use a standard rectangular quadrant, we will not be able to separate the three populations in the plot, as demonstrated in Figure T6.5.
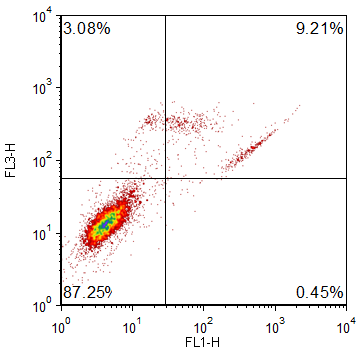
Figure T6.5 Improperly Defined Regions Using Standard Quadrants
To surmount this problem, we will create floating quadrants on this plot.
1.Select the Gating tab→Create Gates group→Quadrants command (Figure T6.1).
2.Click in the middle of the right plot.
A window appears called Create New Quadrants (Figure T6.2). The radial button called Create new quadrants named is selected.
3.Click OK.
A set of standard quadrants will appear similar to Figure T6.5 (above).
4.Click the View tab→ Navigators group→ Gate Navigator  command.
The Gate Navigator will appear (Figure T6.7).
5.Expand the Gate node
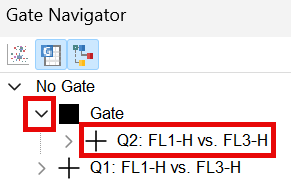
Figure T6.7 Gate Navigator showing the Quadrants
6.Double-click on Q2: FL1-H vs. FL3-H. The Edit Quadrant window will appear (Figure T6.8)
7.Add a checkmark to the checkbox labeled Floating (allow angles other than 90 degrees). Click OK.
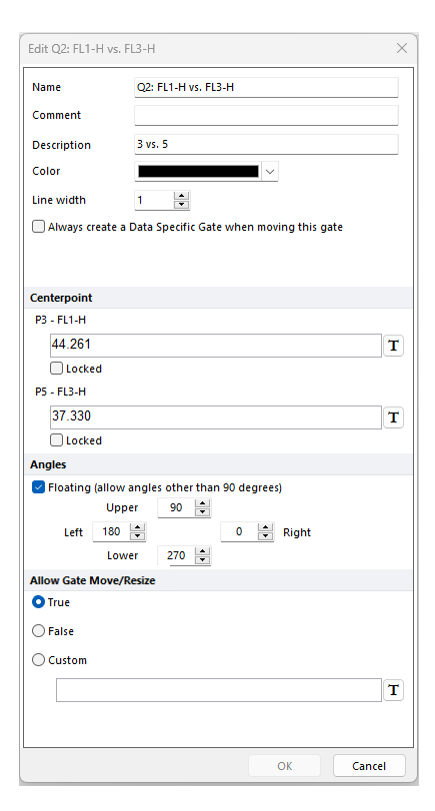
Figure T6.8 Edit Quadrant window
8.Click on the right plot in the middle of the quadrant, on the central vertex, to activate the quadrant (if not already activated).
Notice that not only does the central vertex show a small square, but also the ends of the quadrant lines have small squares as well, indicated by the red circles on (Figure T6.9). The ends of the quadrant lines are now movable vertices.
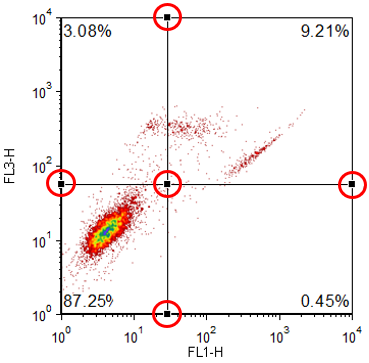
Figure T6.9 Activated Floating Quadrant
9.Place the cursor over the small square on the central vertex; the cursor should change to a four-headed arrow.
10. Hold down the left mouse button and move the central vertex into the middle of the three populations on the plot.
11. Release the mouse button when the central vertex is in the desired location.
12. Place the cursor over the end vertex on one of the quadrant lines; again, the cursor should change to a four-headed arrow.
13. Hold down the left mouse button and move the vertex of the quadrant line along the axis or plot border to separate the three populations.
14. Release the mouse button when the quadrant line node is in the desired location.
Repeat Steps 12 through 14 until all of the vertices of the quadrant lines have been moved. The final result should resemble Figure T6.10.
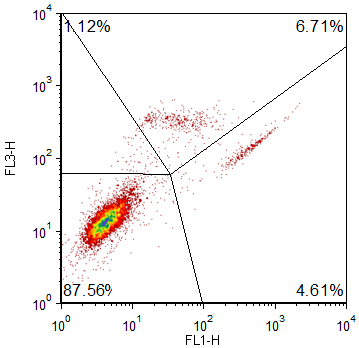
Figure T6.10 Floating Quadrants
Next, we will set up percentile quadrants.
