Scatter Plots
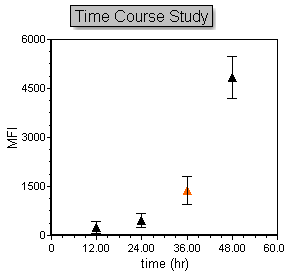
Scatter plots facilitate the observation of relationships between two variables*. These variables may be native to the experiment (e.g., time and fluorescence .fcs file parameters), simple statistical tokens derived from different plots or populations, or complex statistical formulae defined in Custom Tokens. Unlike bar plots and pie charts, scatter plots are true 2D plots.
Scatter Plots (e.g., Figure 5.236)can be inserted anywhere on your layout, and are populated from Spreadsheets containing statistical tokens or freetext. They are also fully formattable.

Figure 5.234. Scatter Plot in FCS Express
* Note: If you plan on performing a regression analysis (best-fit curve) of your data, it is strongly recommended to insert a Scatter with Regression Plot instead. Scatter with Regression Plots facilitate automatic overlay of the regression curve onto your raw data.
