Using a Channel Calibration
FCS Express offers two levels of control in determining whether a parameter will have a calibration applied to it: A global control, and an individual plot-by-plot control.
If you do not want the calibration to be used at all, you can select the Tools tab→click Channel Calibration command and uncheck the Active checkbox beside that calibration (Figure 9.174).
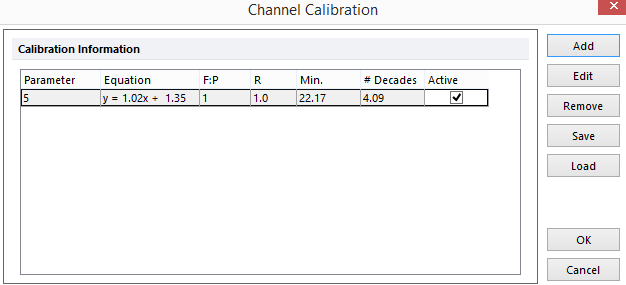
Figure 9.173 Channel Calibration Window with Active Checkbox
You can also choose which individual plots use the calibrations. The Specific Options category of the Format window for both histograms and 2D Plots contains a Use channel calibrated on axis checkbox. If this checkbox is set, calibrations will be used for any parameter that has a calibration defined. If the Use channel calibrated on axis checkbox is not set, the calibration will not be used, irrespective of whether or not that calibration is active (Figure 9.175).
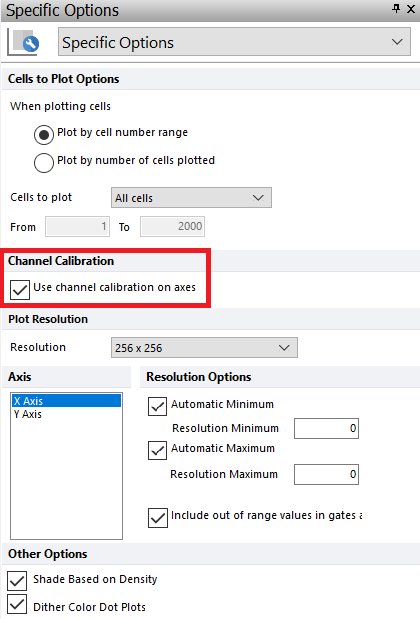
Figure 9.174 Channel Calibration on Axes in Formatting Dialog
Tokens in FCS Express also allow you to monitor if channel calibrations are applied to any axis on your plots (below) and to monitor the last loaded calibration file in the layout.
To monitor channel calibrations on either axis of a plot using the "Is channel Calibration applied on the axis?" token type:
1. Right click on a text box.
2. Choose Insert Token.
3. Choose Plot→Plot Information.
4. Choose "Is channel Calibration applied on the X/Y axis?" in the Plot Elements category.
5. Click OK.
6. Click Insert.
A new token will now be displayed in the text box indicating the calibration status of the axis you chose for the indicated plot (Figure 9.176).
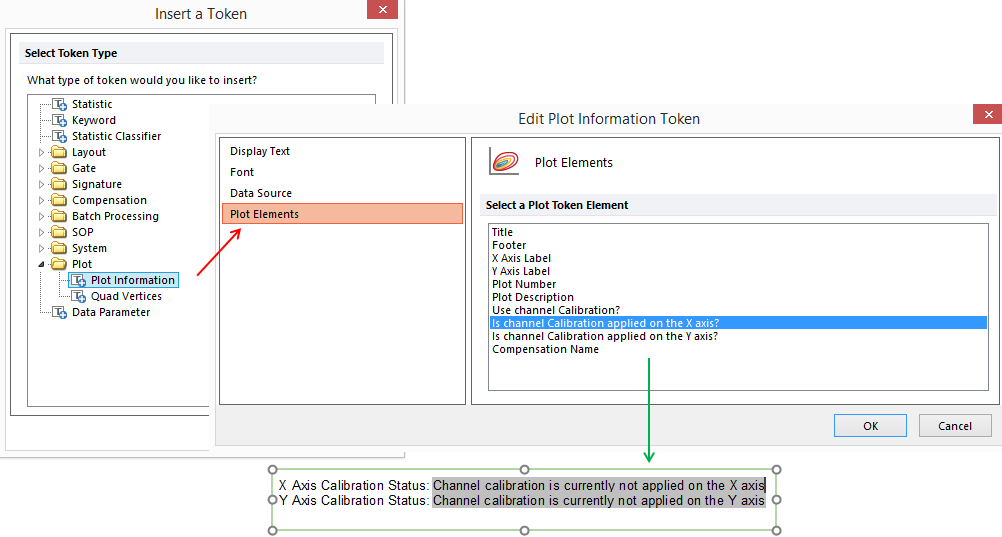
Figure 9.175 Using the "Is channel Calibration applied on the axis?" token type. The token can be access through Plot Information>Plot Elements (red arrow). When the token is inserted it will indicate if a channel calibration is applied on the X or Y axis of a plot (green arrow).
To monitor the Last Loaded Channel Calibration File token type:
1. Right click on a text box.
2. Choose Insert Token.
3. Choose Layout→Last Loaded Channel Calibration File.
4. Click Insert.
A new token will now be displayed in the text box indicating the last calibration file that was loaded into the layout (Figure 9.177).
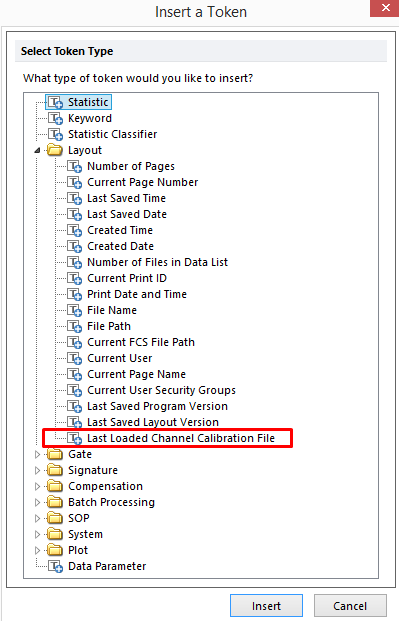
Figure 9.176 Last Loaded Channel Calibration File Token Type
Channel Calibration custom token formulas can be utilized to extract details of channel calibrations assigned to a layout or to a plot by via the Custom Tokens dialog. (Figure 9.178).
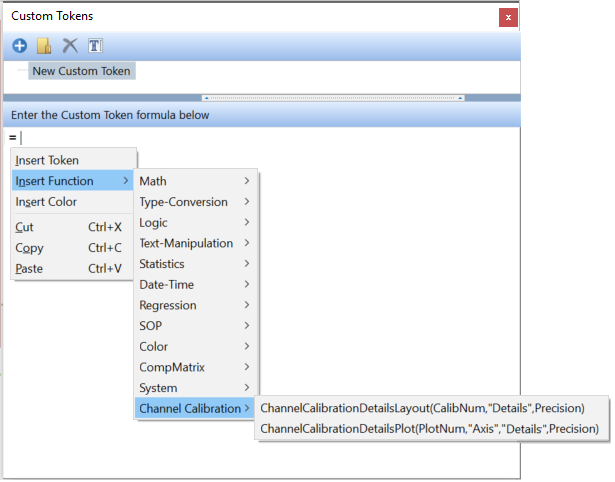
Figure 9.179 Custom Token for Channel Calibration Details
The available variables to report via the custom token are listed below. Please see the chapter on Creating Custom Tokens to learn about using Custom Tokens and the Channel Calibration Custom Token Formula reference information for details on how to utilize the formula reference.
•Antibodies - Determines the absolute value of fluorescent ligands labeling each cell.
•Correlation - Displays how closely the equation fits the actual data, with a value of 1 being a perfect fit.
•Decades - Represents the number of decades of dynamic range your instrument is capable of measuring.
•Equation - is the linear regression formula that was used to calibrate the channels.
•MinAb - Is the minimum number of fluorochromes you are able to resolve.
•Parameter - Displays the parameter the channel calibration applies to.
•Ratio - Refers to the dye molecules:antibody ratio
•Status - Indicates whether this calibration is active or inactive for the selected calibration.
•DyeMolecules - The correlation of the channel number to the number of dye molecules per bead established from the standard curve.
