Excel Report (Cell Mode)
In the course of this example, we will:
•Create an Excel – Cell Mode Report.
•Export the $FIL keyword.
•Export the $DATE keyword.
•Export a Statistic.
•Export a Picture.
•Run a batch process.
For convenience, we are going to start with the same layout as before. The images contained within this section will continue with the layout from the previous section. However, you can add reports to layouts that already have actions defined. If you have the previous layout still open, please jump to Step 5.
1.Select the File tab and click on Open.
2.Open the layout BatchProcess.fey found in the Tutorial Sample Data archive.
To Perform an Excel Report Batch Process:
3.Add TCellSample1.fcs and TCellSample2.fcs as necessary (see the previous section).
4.Select the Batch & Export tab→ Batch Export to PDF, PowerPoint, Excel, Prism, ... group→ Actions and Reports command  .
.
A Batch Actions window will appear (Figure T10.7).
5.Click on the Add Action drop-down menu and select Excel→Export to Excel (Cell Mode).
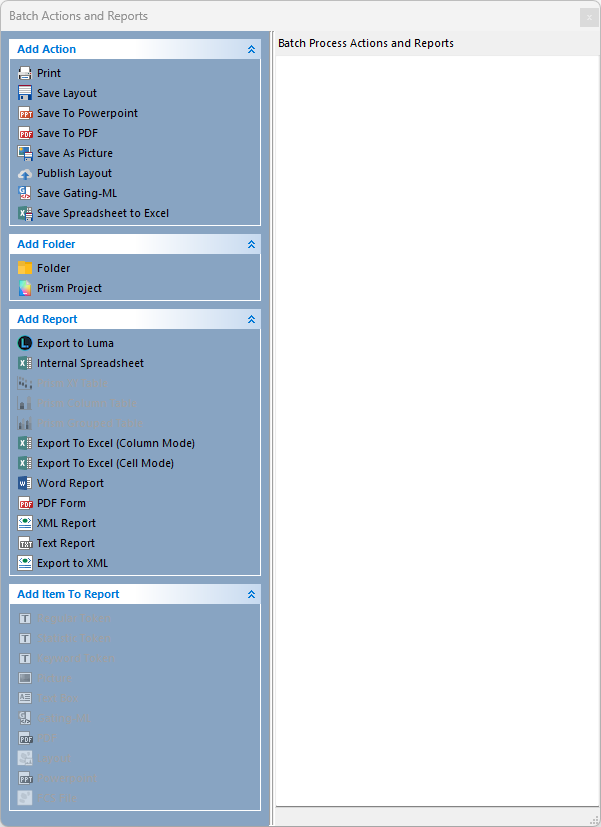
Figure T10.14 Add Report Section of Batch Actions and Reports with Export to Excel (Cell Mode) shown
An Excel (Cell Mode) Options dialog will appear (Figure T10.15). We will use this dialog to set up the batch export to Excel (Cell Mode).

Figure T10.15 Excel (Cell Mode) Options Dialog
6.Click the folder icon in the Template Document: field (Figure 10.15, ![]() ).
).
7.Select T Cell Analysis Template.xlsx from FCS Express Tutorial Sample Data folder.
T Cell Analysis Template.xlsx is an Excel file that contains the background for your report. (The Excel template we are using is shown in Figure T10.16.)
8. For Iteration Options, click the radio button next to Combine all iterations in the same document (Figure T10.15, ![]() ).
).
9. For Output file options, click the folder icon for Save to a new file field to designate where to save and name it (Figure T10.15, ![]() ).
).
10. Check box to Open file after saving (Figure T10.15, ![]() ).
).
11. Click OK (Figure T10.15).
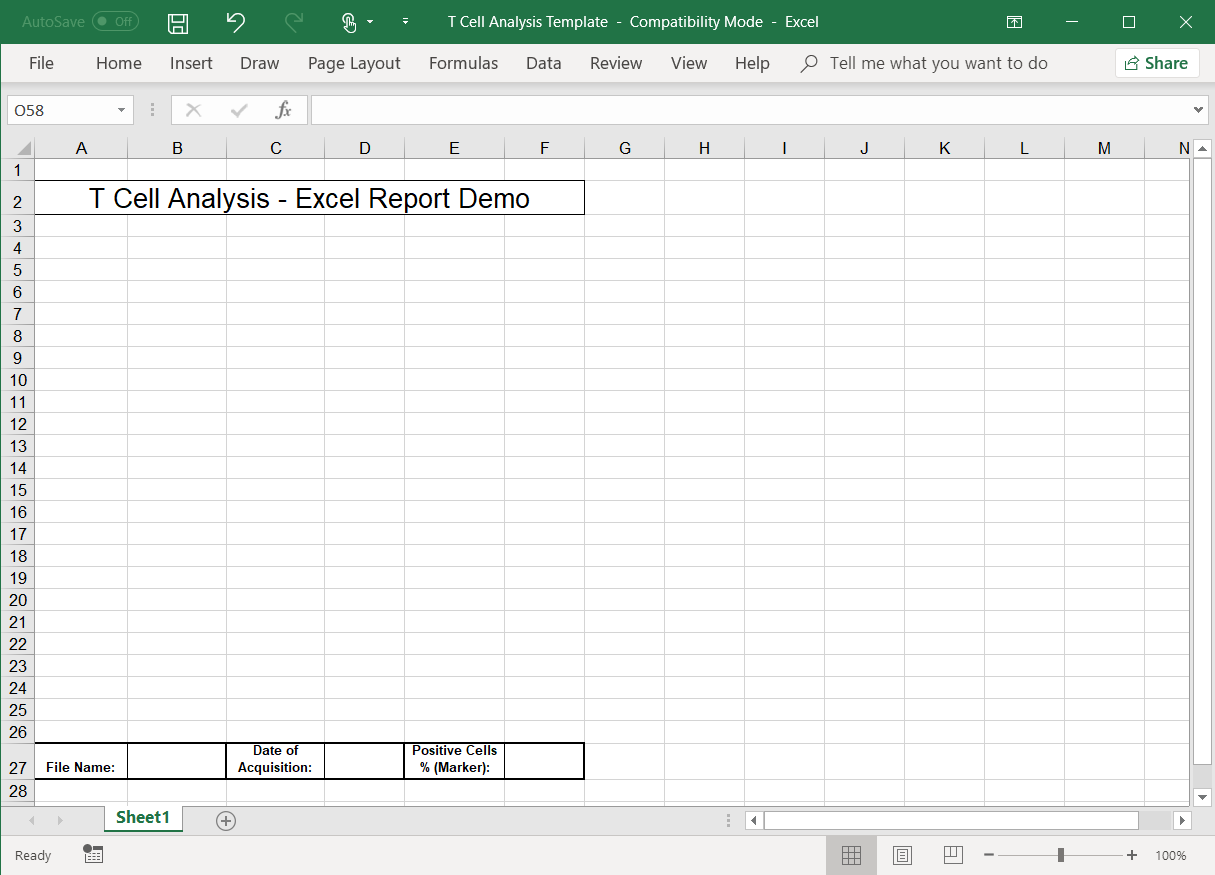
Figure T10.16 Cell Analysis Excel Template
The Batch Actions and Reports window will show the export to Excel (Cell Mode) action listed.
Note: the Save To PowerPoint Batch Action may also be present if you saved and reopened this layout to continue from the previous section.
12. Click Keyword Token from the Add Item to Report category (Figure T10.18).
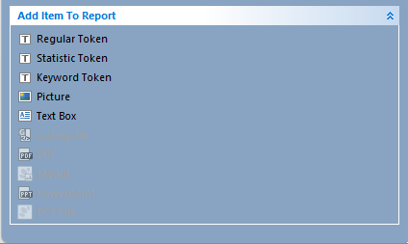
Figure T10.18 Add Item to Report section of Batch Actions and Reports Window with Keyword Token shown
An Excel (Cell Mode) field "Keyword" options dialog will appear showing the Data Source category (Figure T10.19). This is where we will define the "keywords" to export to Excel.
13. For the Data Source category, select 4 - Histogram - TCellSample1.fcs compensated (FITC-A).
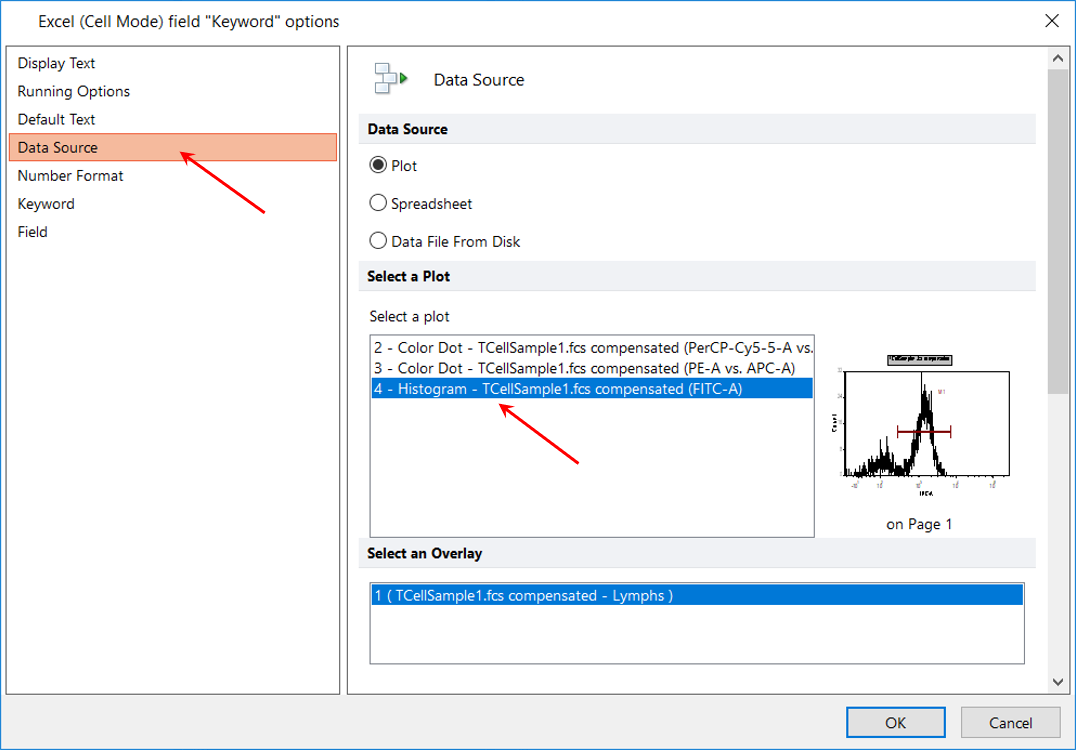
Figure T10.19 Defining Data Source for Keyword
14. Click on the Keyword category. (Figure T10.20, red arrow).
15. Click the ellipsis (…) button to the right of the Select a keyword field (Figure T10.20, red outline).
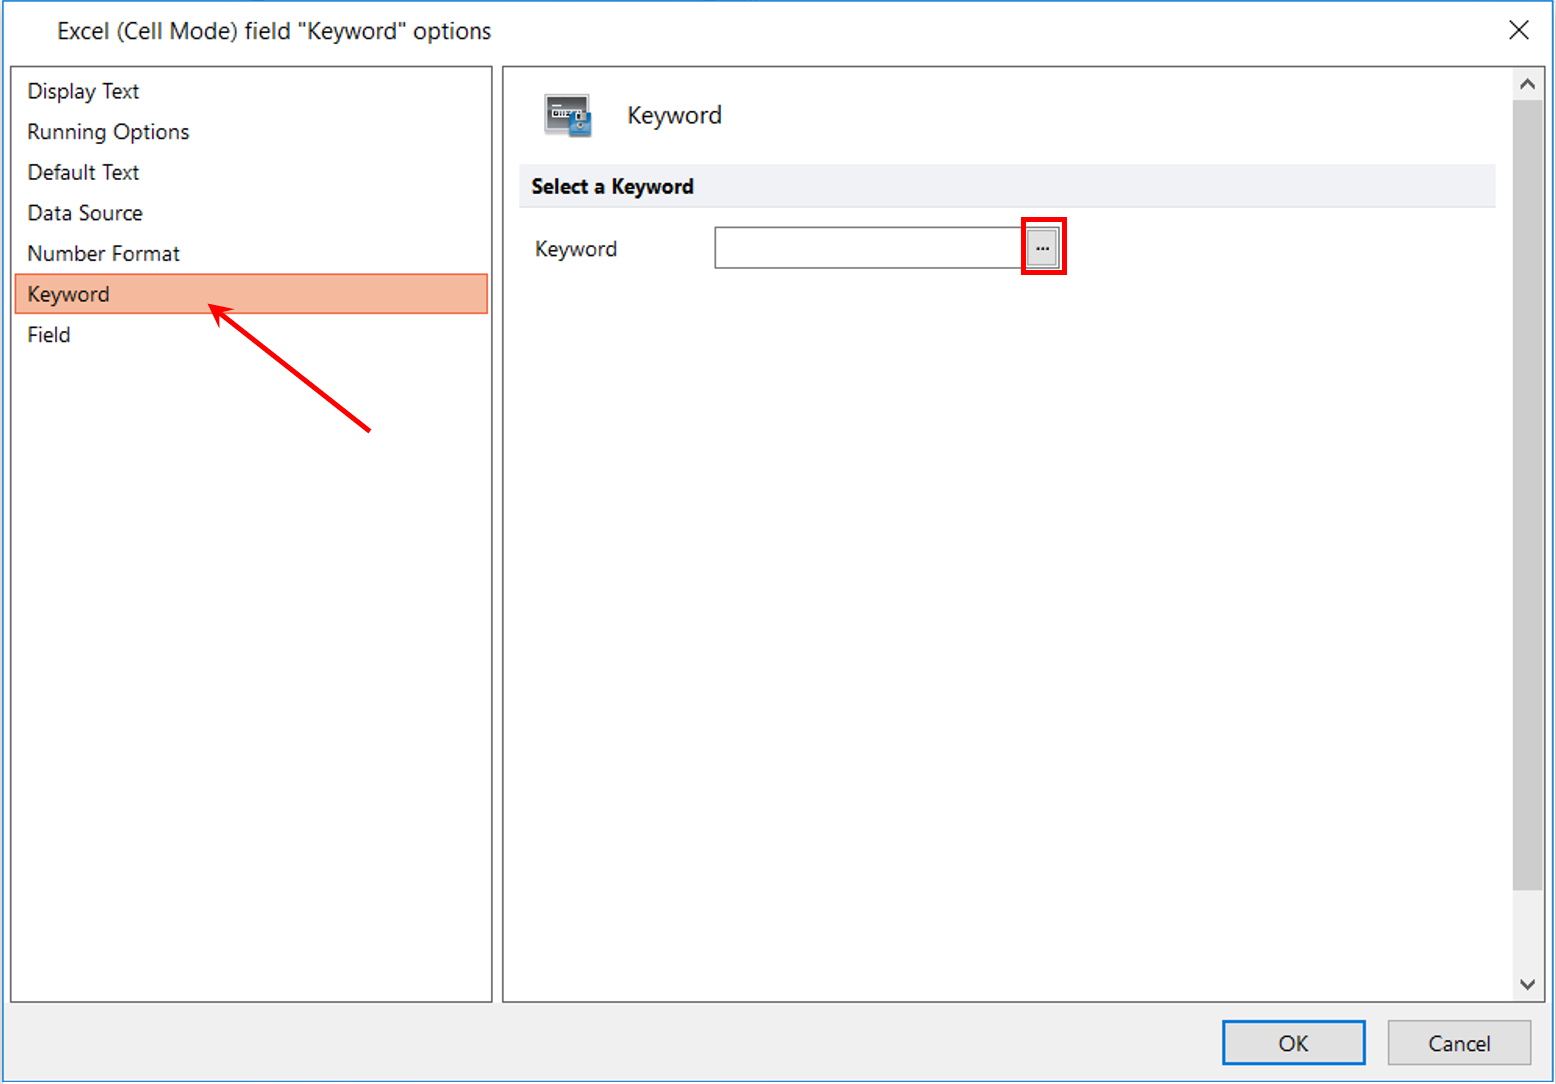
Figure T10.20 Excel (Cell Mode) field "Keyword" options Dialog - Keyword Category
The Please select a keyword dialog will appear (Figure T10.21). This dialog displays the keywords found in the FCS file.
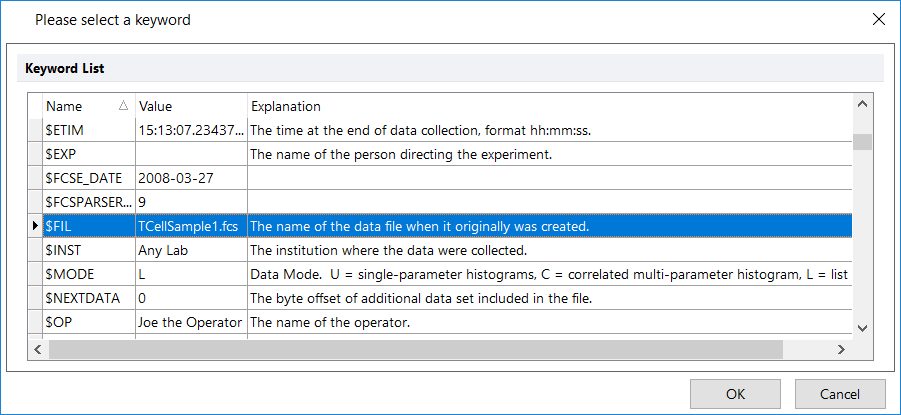
Figure T10.21 Dialog Displaying Keywords Found in the FCS File
16. Select the keyword $FIL (Figure T10.21), which is the file name keyword stored in the FCS File.
17. Click OK.
18. Click on the Field category of the Excel (Cell Mode) field "Keyword" options dialog (Figure T10.20, red arrow).
The Field page of the Excel (Cell Mode) field "Keyword" options dialog will appear. Here, we identify the Excel cell address to which the $FIL keyword data will be batch exported.
19. Type B27 in the Cell Address field (Figure T10.22, red outline) of the template Excel file (Figure T10.16 above).
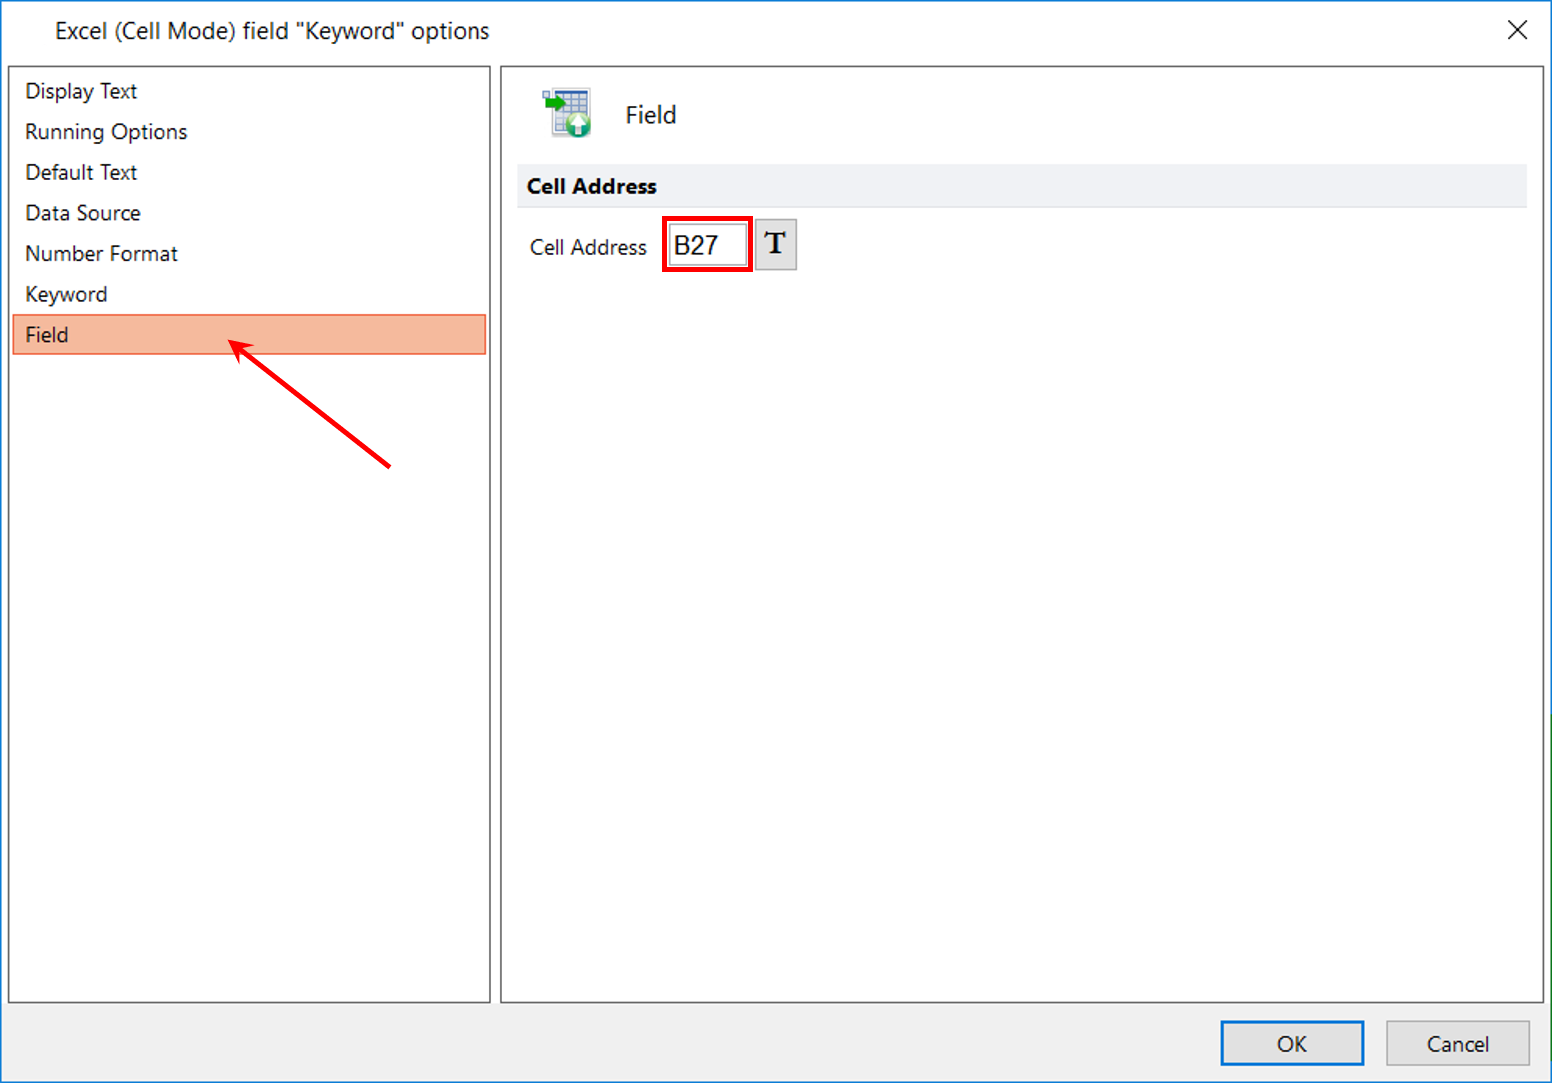
Figure T10.22 Defining Cell Address for the Filename Keyword in the Excel Report
20. Click OK.
The Batch Actions and Reports window will show the action Keyword: $FIL added to the Excel (Cell mode) action (Figure T10.23).
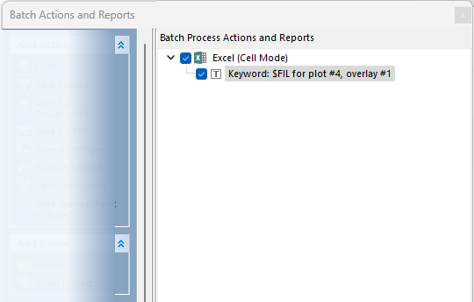
Figure T10.23 Filename Added to Excel (Cell Mode) Report
You also can select a token associated with a plot to batch export to Excel by dragging and dropping the plot or gate of interest from the layout page onto the Batch Process Actions section of the Batch Actions dialog.
21. Click on the histogram.
22. Position cursor on green or red outline of plot to switch to four-headed arrow.
23. Click and hold the left mouse button while in four-headed state and drag the histogram to the Batch Process Actions and Reports section of the Batch Actions and Reports dialog (Figure T10.24).
24. Release the mouse button when the cursor is on top of the Excel (Cell Mode) text inside the Batch Process Actions and Reports section (Figure T10.24). A Paste Special dialog box will appear (Figure T10.23).
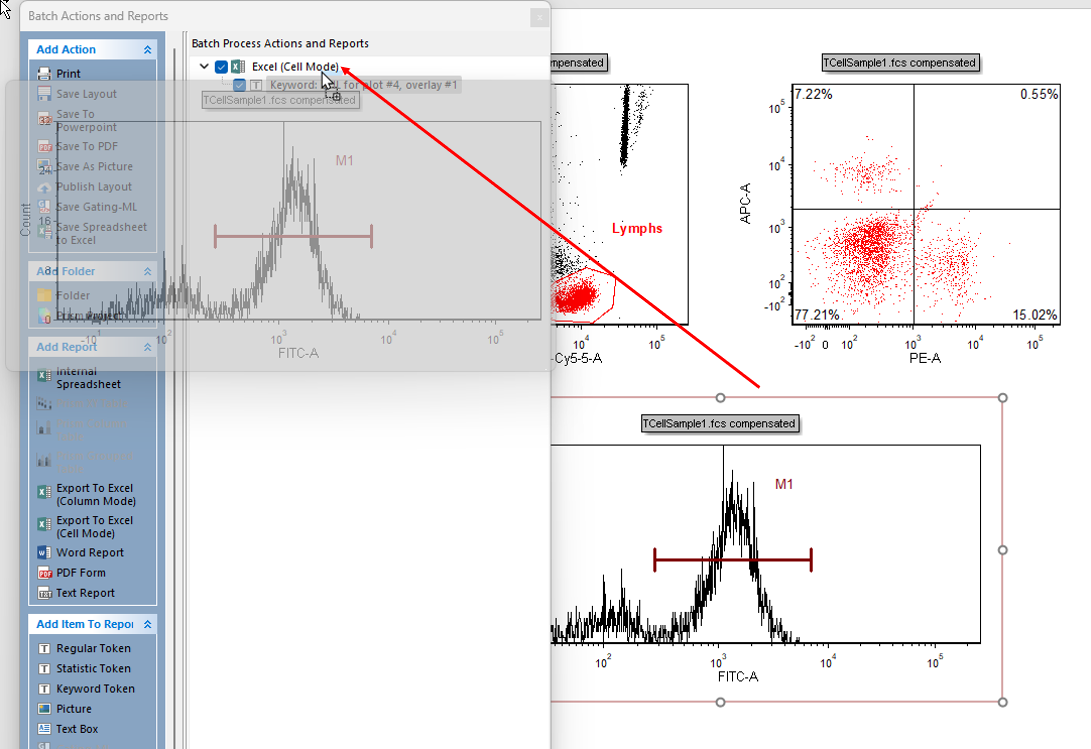
Figure T10.24 Dragging and Dropping a Histogram onto the Batch Actions and Reports Window
25.Select the Keyword token and click OK (Figure T10.25).
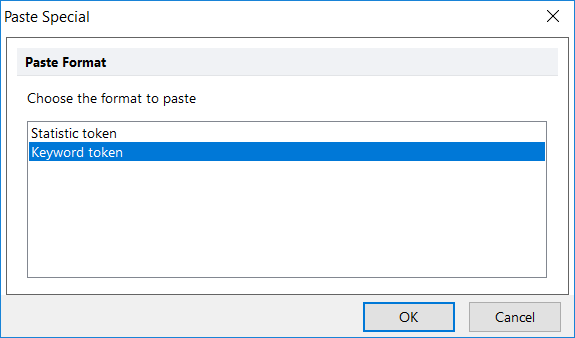
Figure T10.25 Paste Special Dialog
26. The Keyword category page will appear, which is similar to Figure T10.20.
27. Click on the ellipsis (…) button to the right of the field Select a keyword.
A Please select a keyword dialog will again appear (Figure T10.26).
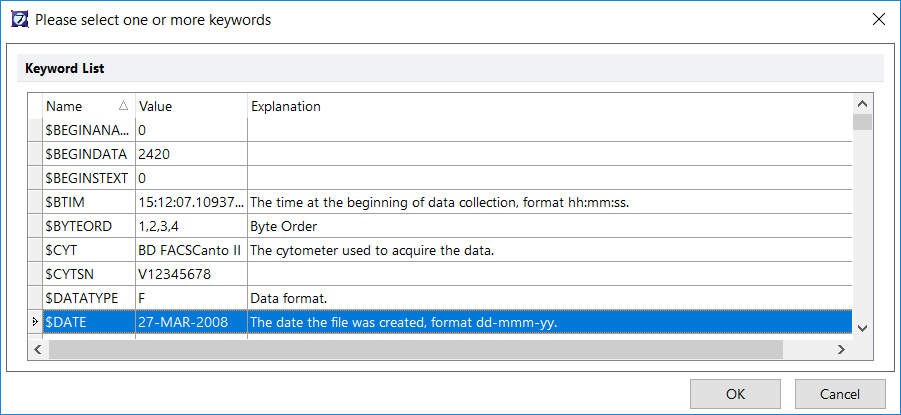
Figure T10.26 Inserting the $DATE Keyword
28. Select the keyword $DATE (Figure T10.26).
29. Click OK (Figure T10.26).
30. Click OK to close Keyword Options dialog.
31. Double-click on newly-added $DATE keyword token or right-click it and click Properties from submenu (Figure T10.27).
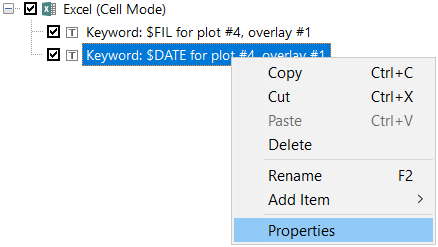
Figure T10.27 Accessing Token Properties by Right-Click
32. Click the Field category from the Excel (Cell Mode) field "Keyword" options dialog (Figure T10.28, red arrow).
The Field page of the Excel (Cell Mode) field "Keyword" options dialog will appear again.
31. Type D27 in the Cell Address field (Figure T10.28, red outline).
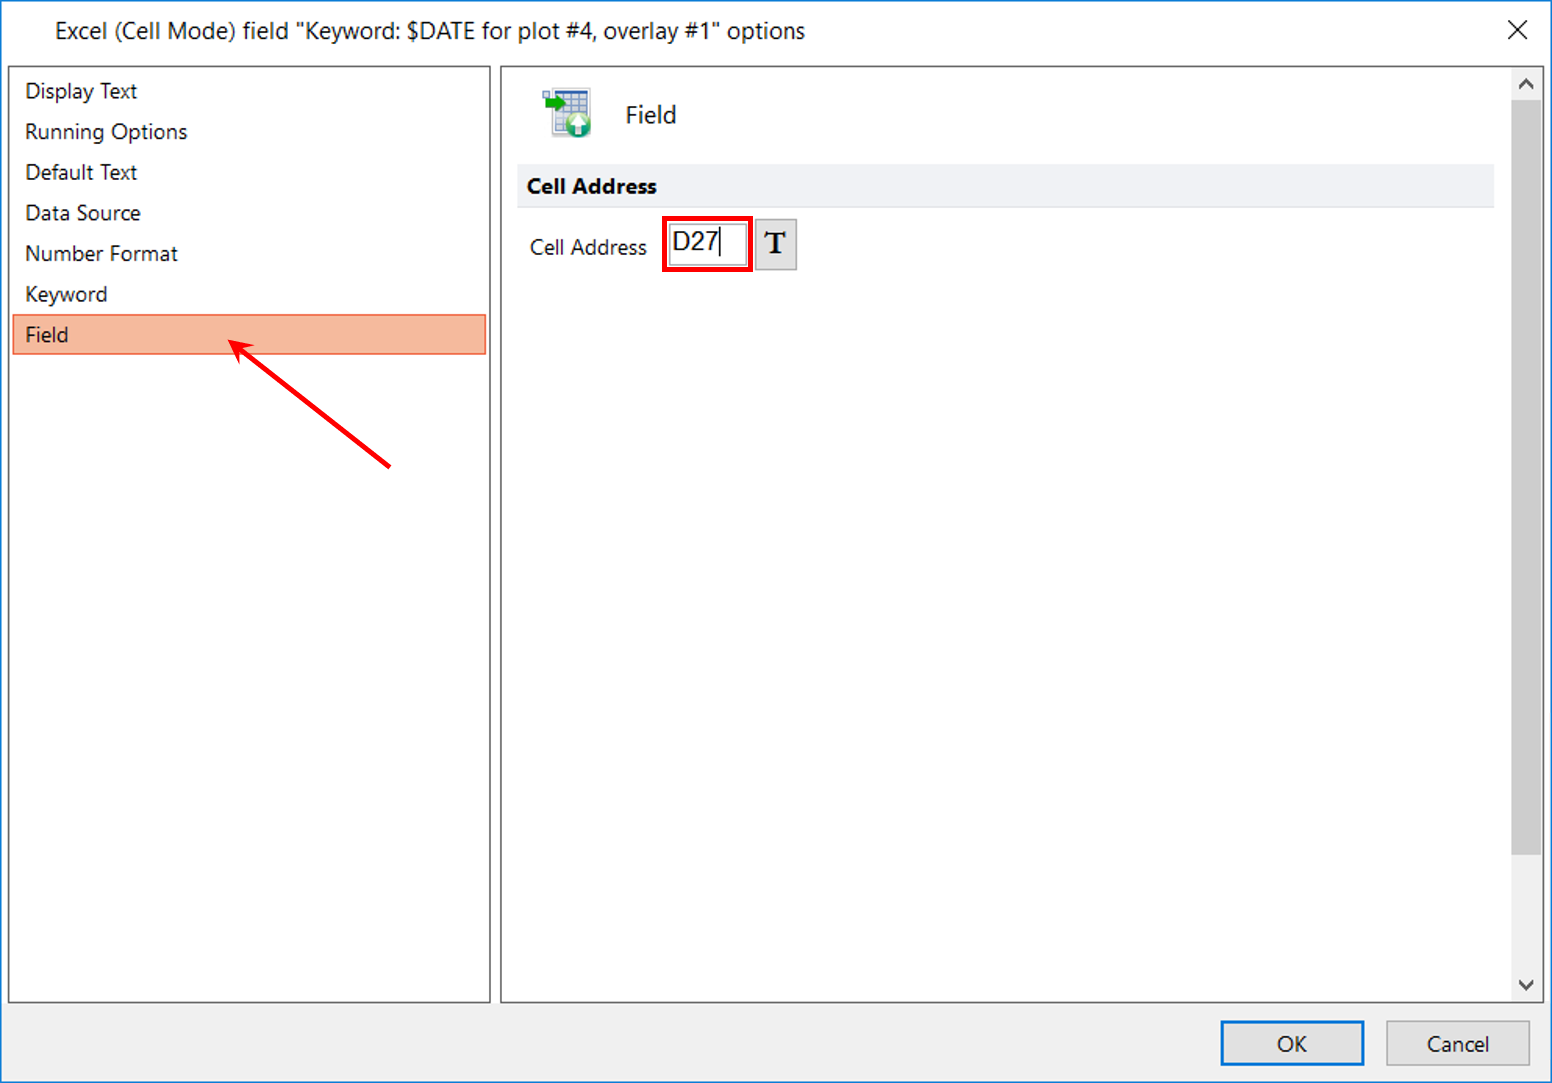
Figure T10.28 Defining Cell Address for $DATE Keyword Excel (Cell Mode) Report
32. Click OK (Figure T10.28).
The Batch Actions and Reports window will show the action Keyword: $DATE added (Figure T10.27). If the batch analysis were run now, using the files in the Data List, the file name, saved in the FCS keyword $FIL, and the date, saved in the FCS keyword $DATE, would be exported to cells B27 and D27, respectively,of the Excel file previously specified in Figure T10.16 above.
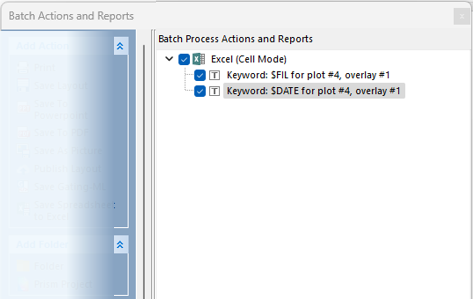
Figure T10.27 Adding Statistic Token to Excel (Cell Mode) Report
We are now going to select a Statistic to batch export to the Excel file.
33. Select Statistic Token from the Add Item to Report category of the Batch Actions and Reports window (Figure T10.18 above).
An options dialog will appear.
34. Click on the Data Source category (Figure T10.19 above).
35. Select 4 - Histogram - TCellSample1.fcs compensated (FITC-A) from the Select a plot field (Figure T10.19 above).
36. Click on the Statistic Category. The Statistic page of the Excel (Cell Mode) field "Statistics" options dialog will appear. From this dialog, we will define to statistic to add (Figure T10.30).
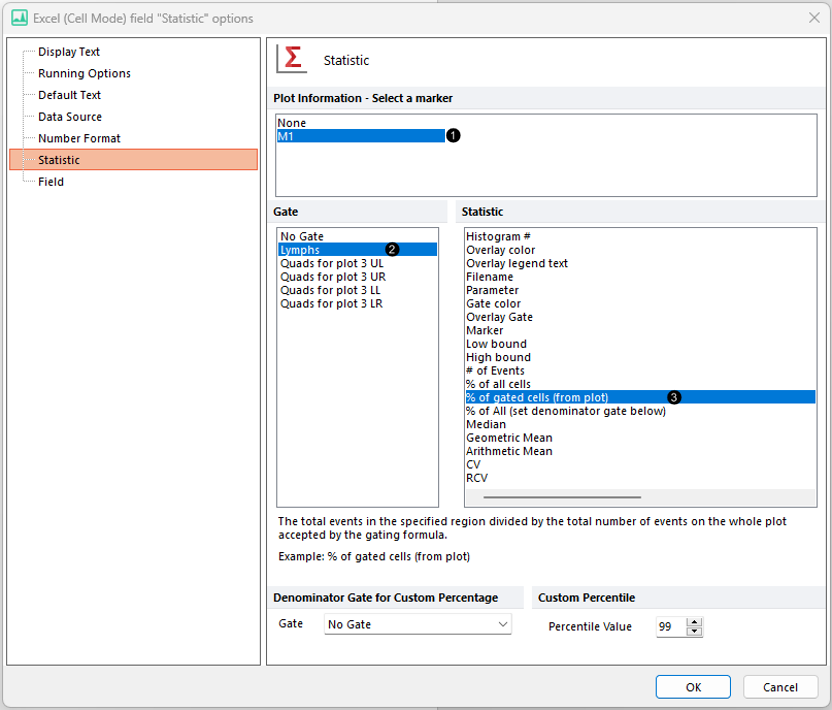
Figure T10.30 Selecting a Statistic to Export
37. Select the marker M1 from the Plot Information - Select a marker list box (Figure T10.30, ![]() ).
).
38. Select the Gate Lymphs from the Gate list box (Figure T10.30,![]() ).
).
39. Select the Statistic % of gated cells from the Statistic list box (Figure T10.30 ![]() ).
).
40. Click on the Field category. The Field category of the Excel (Cell Mode) field "Statistics" options dialog will appear (Figure T10.31). This is where we define the Excel cell address to which the statistic data will be batch exported.
41.Type F27 in the Cell Address field (Figure T10.31).
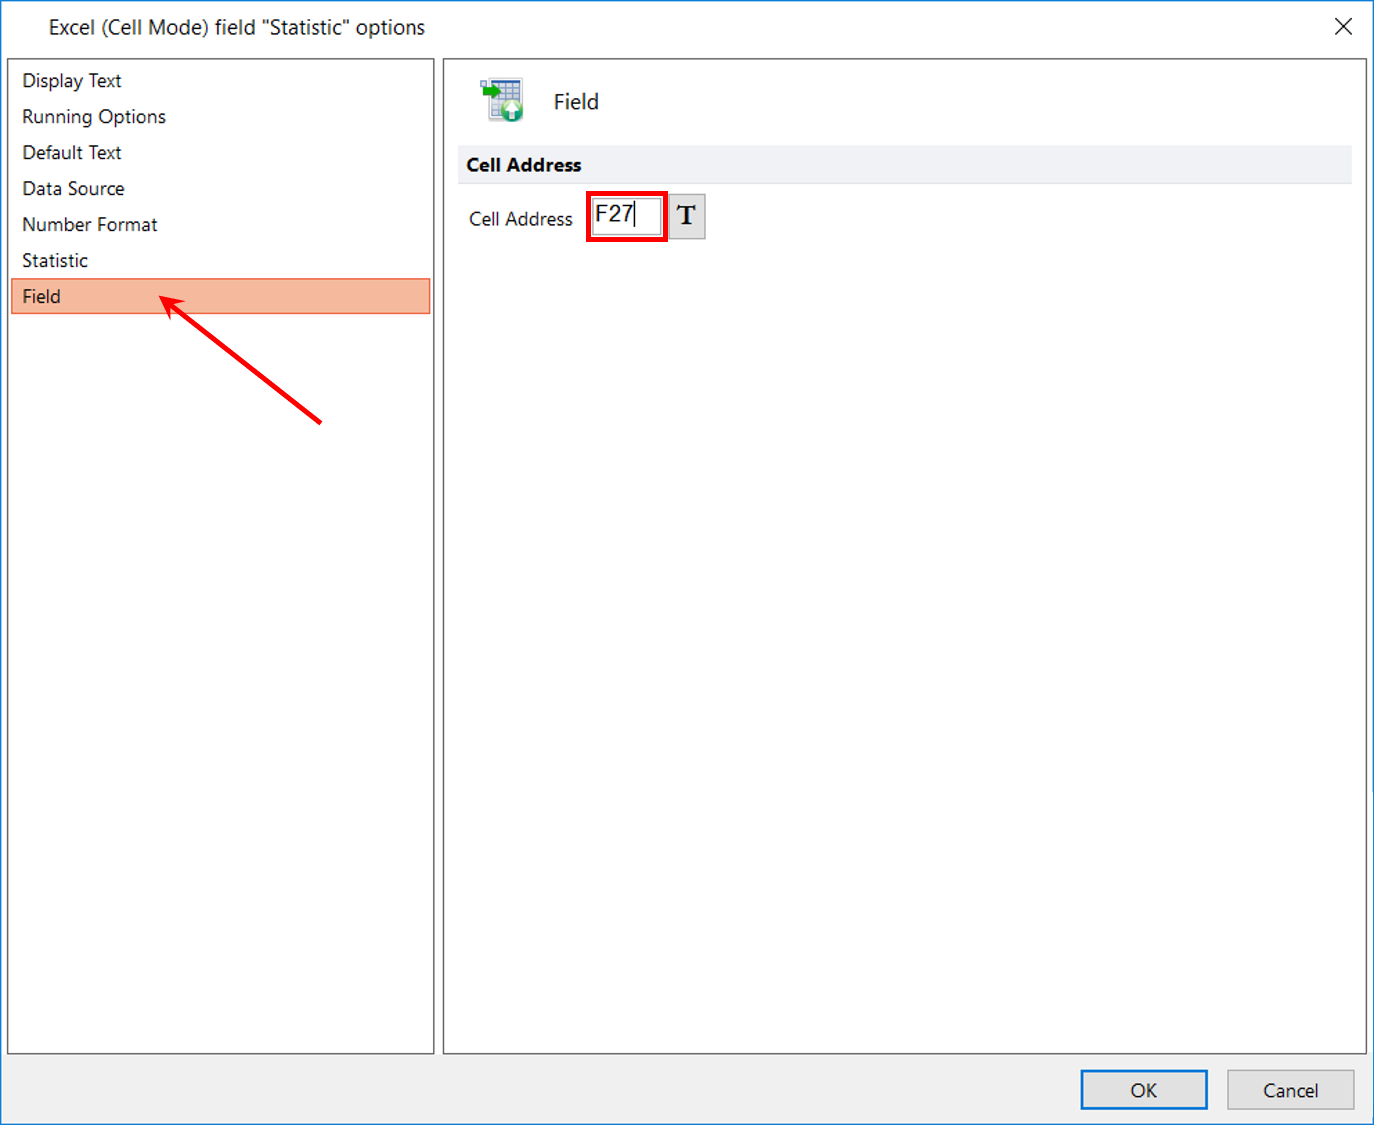
Figure T10.31 Defining Cell Address of Statistic for Excel (Cell Mode) Report
42. Click OK to accept the changes.
The Batch Actions and Reports window will show the action Statistic: % of Gated Cells added (Figure T10.32).
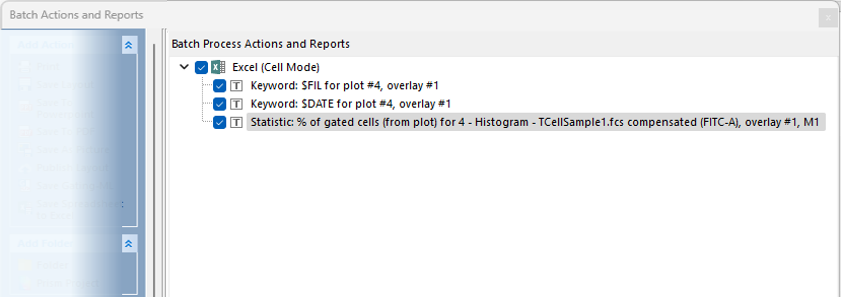
Figure T10.32 Batch Actions and Reports with Statistic % of Gated Cells to be Exported to Excel
We will now select a picture to batch export to the Excel file.
42. Click Picture from the Add Item to Report section (Figure T10.18 above).
An Excel (Cell Mode) field "Picture" options dialog will appear (Figure T10.33). In this dialog, we will define the details of the picture to be exported to Excel.
43. Select 4 - Histogram – TCellSample1.fcs compensated (FITC-A) in the Select a Plot field (Figure T10.33, blue highlighted text).
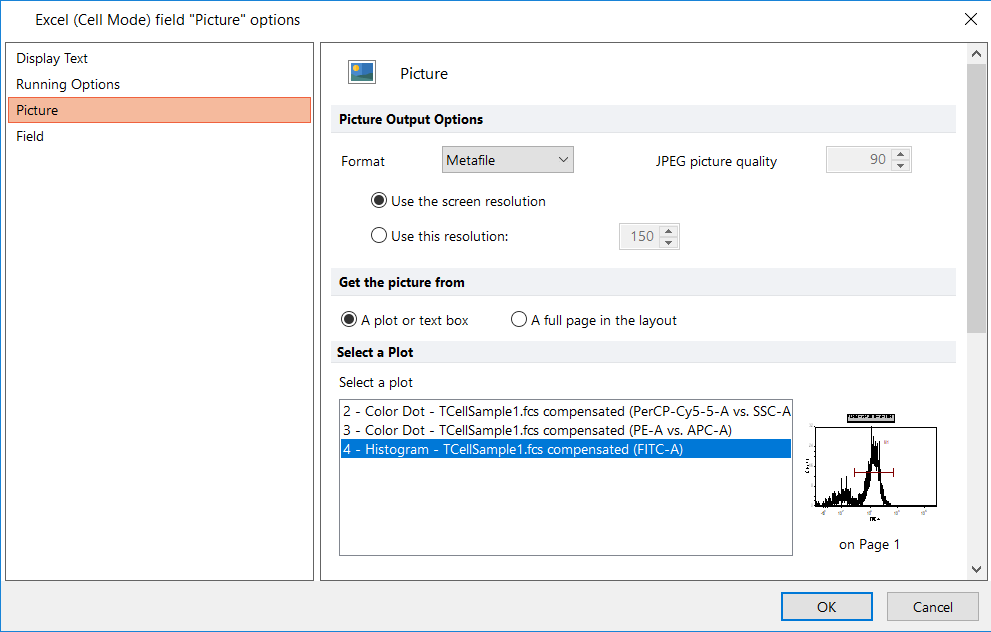
Figure T10.33 Selecting Plot for Picture in Excel (Cell Mode) Export
44. Click on the Field category (Figure T10.34, red arrow).
The Field category of the Excel (Cell Mode) field "Picture" options dialog will appear (Figure T10.34, red arrow). Here, we define the Excel cell address to which the picture will be batch exported.
45. Type A8 in the Cell Address field (Figure 10.34, red outline).
46. Click OK.
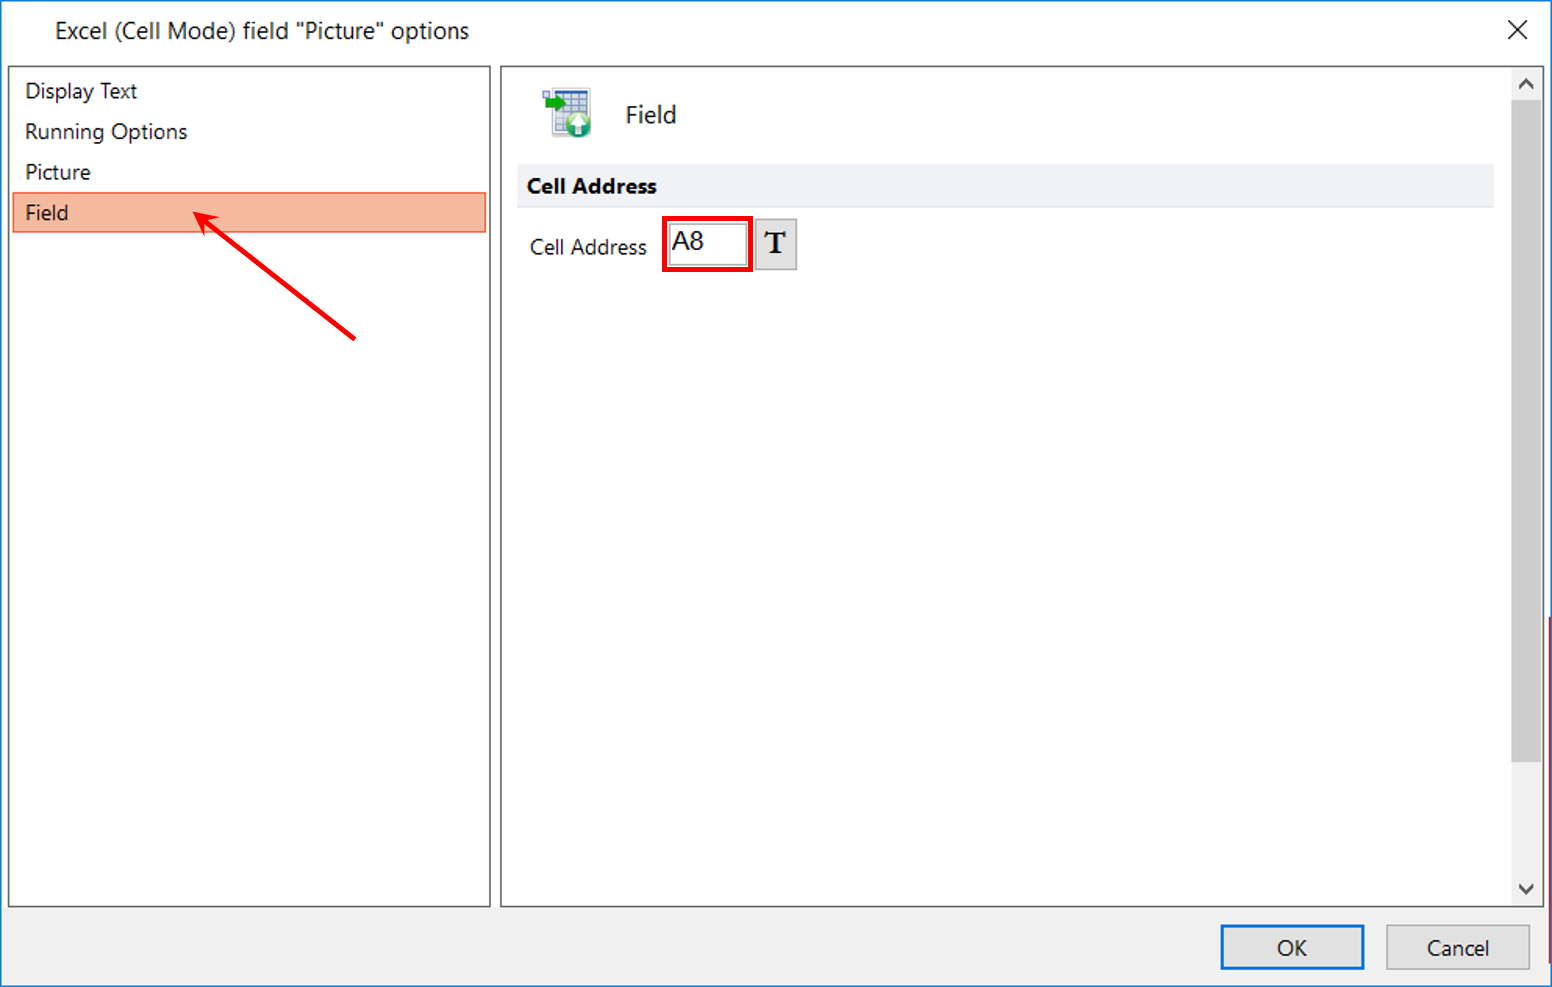
Figure T10.34 Defining Cell Address for Picture of Excel (Cell Mode) Report
We have instructed FCS Express to export a picture of 4 - Histogram – TCellSample1.fcs compensated (FITC-A) to cell A8 of the Excel report template.
The Batch Actions and Reports window will show the action Picture added (Figure T10.35).
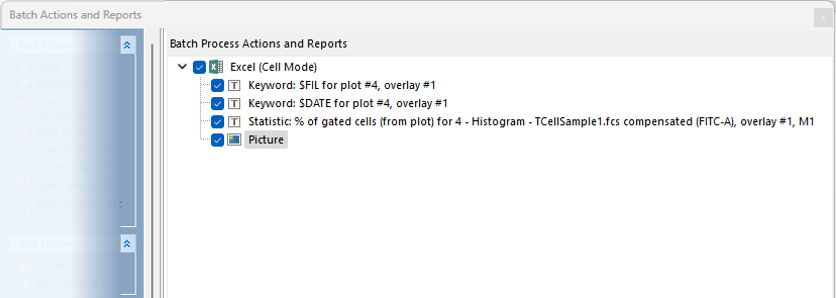
Figure T10.35 Picture Added to List of Items for Excel (Cell Mode) Report
47. Click the Close button (red x) in the upper right corner of the window to close the Batch Actions window (Figure T10.35).
We will now return to the layout page and run the Batch Processing.
48. Click Batch & Export tab→Batch Export to PDF, PowerPoint, Excel, Prism, ...→Run or Replay→Run command (Figure T10.10).
FCS Express will now execute the Batch Process. When the Batch Process is complete, an Excel file will be created (Figure T10.36) at the location you specified, with two worksheets, one for each of the two files TCellSample1.fcs and TCellSample2.fcs.
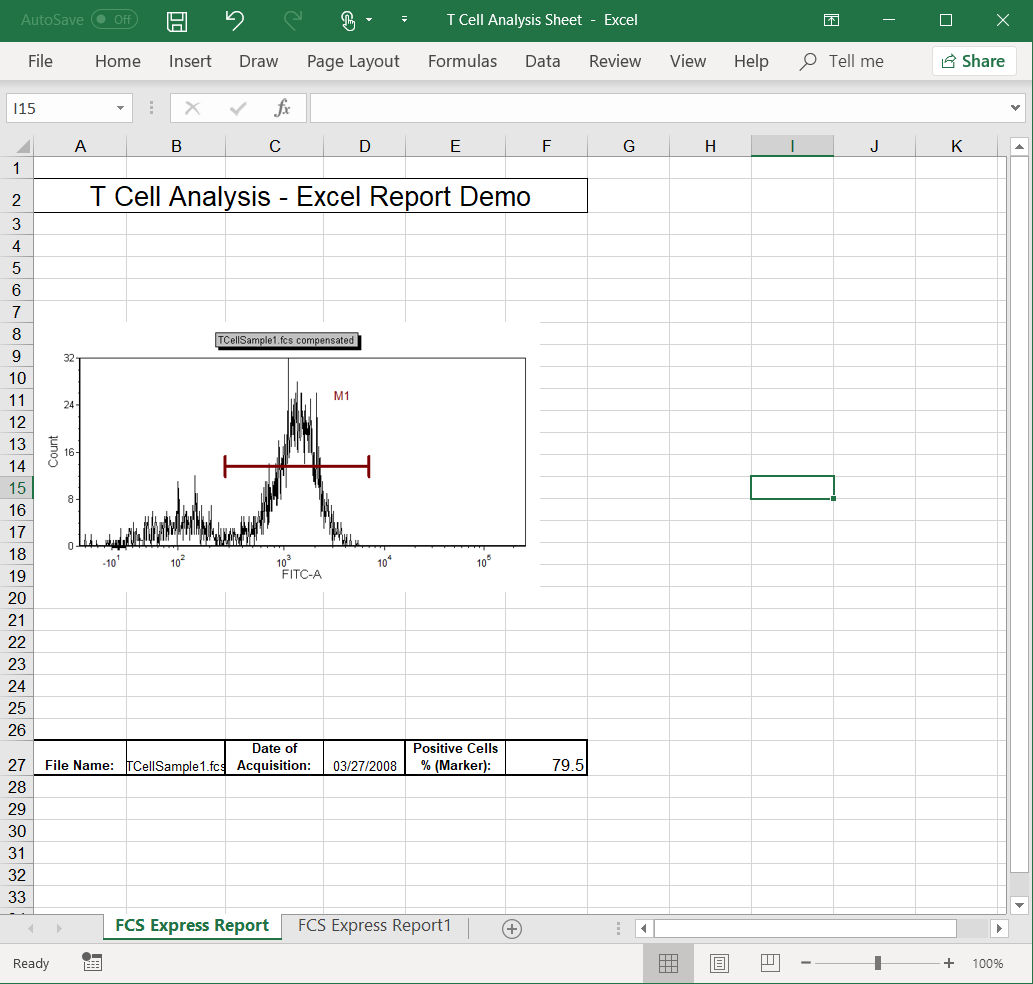
Figure T10.36 First Sheet of the Final Excel Report from the Batch Processing
We will continue to use this same layout in the next exercise.
Next, we will batch process an Excel report in column mode.
