Gates To Display
The Gates to Display formatting option for Data Grids determines the backgating information displayed within the Data Grid. The formatting option does not apply to Custom Data Grids.
You can edit the Gates to Display in one of two ways:
•Select the Data Grid(s) and use the Format→Data Options→Gates to Display command.
•Right-click on the Data Grid, select Format from the pop-up menu, and choose Gates to Display from the dropdown (Figure 5.177).
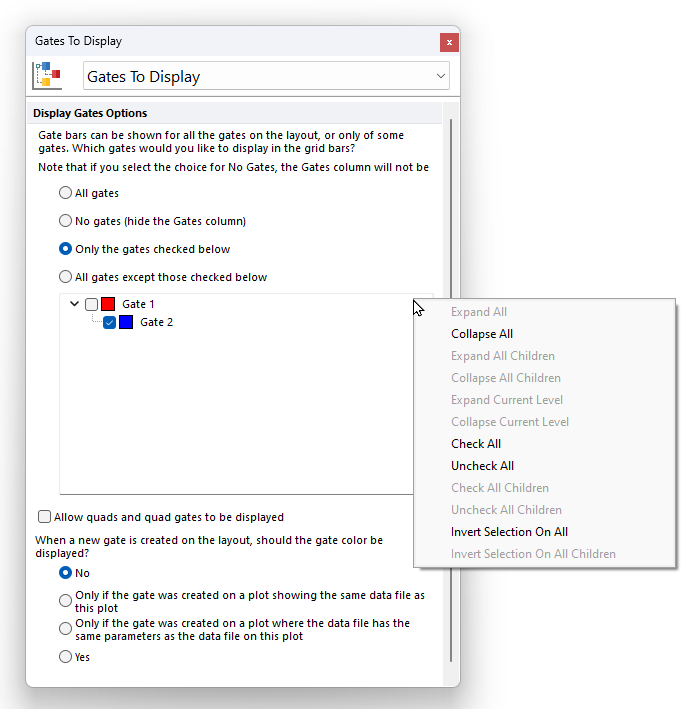
Once the Gate to Display dialog is open, you select a gating scheme using the radio buttons among:
•No Gates (hide the Gates column) (this is the default setting)
•All gates
•Only the gates checked below and then select the gates whose colors you wish to display.
•All gates except those checked below and then choose the gates whose colors you do not wish to display.

Figure 5.175 The Gates to Display formatting dialog for a Data Grid. The right-click menu is also available.
A right-click menu is available within the Gate to Display dialog as displayed in the figure above. Said right click menu allows to:
•Expand/collapse All gates
•Expand/Collapse All Children gates within the selected gate
•Expand/Collapse Current Level (this expand only the first level of children gates within the selected gate)
•Check/Uncheck All gates
•Check/Uncheck All Children gates within the selected gate
•Invert Selection on All gates
•Invert Selection on All Children gates within the selected gate
Allow quads and quad gates to be displayed. Check or uncheck this option to show or hide quadrants and quadrant gates in the Data Grid.
In the When a new gate is created on the layout, should the gate color be displayed? category you can also choose how to display the gate color when a new gate is created on the layout. Possible choices are:
•No
•Display the gate color on a back-gated plot Only if the new gate was created on a plot showing the same data file (as the plot where the new gate was created),
•Display the gate color on a back-gated plot Only if the new gate was created on a plot showing the same parameters (as the plot where the new gate was created).
•Yes
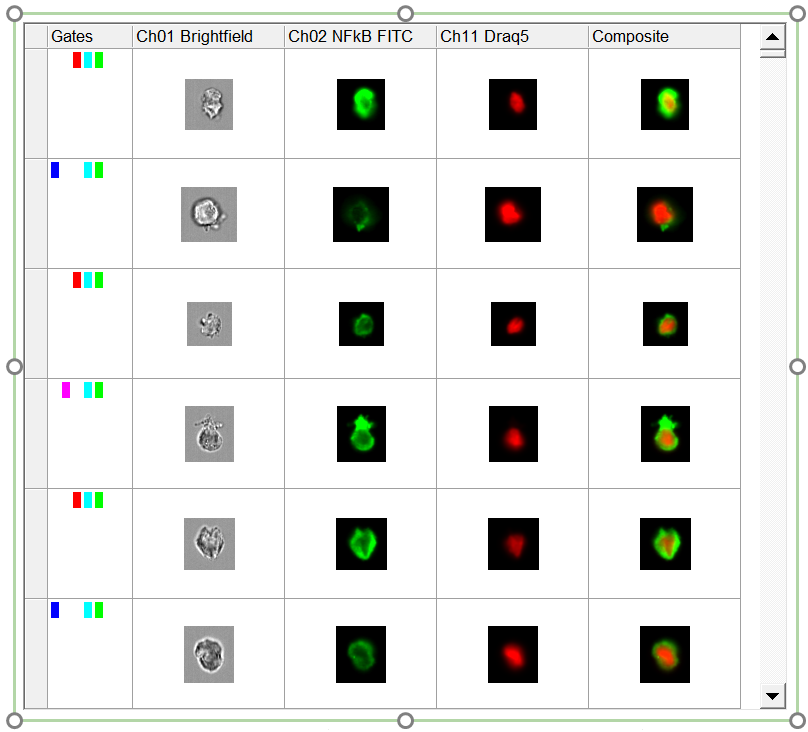
When gates are displayed in a Data Grid, a Gates column is present. If an event falls in one or more gates, colored bars (according to the gate colors) will be shown in the Gates column (Figure 5.178).

Figure 5.176 Backgated Data Grid. Bars in the Gates column of some events show in which gate(s) the cells fall.
