Quadrants
Quadrants are generally used to divide the plot content into 4 complimentary, and mutually exclusive, regions. Quadrants can quickly report statistics from any 2D plot. In FCS Express 7.20 and later, gates are automatically created from quadrants and can be used in downstream population analysis. Quadrants are accessed by selecting the Gating tab→Create Gates→Quadrants command and subsequently clicking on the plot of interest. Aspects of quadrants including color, size, and type may be controlled by using quadrant formatting.
In FCS Express each Quadrant Set is made up of at least four individual Quadrant Gates. Only one Quadrant Set can be displayed on a plot at a given time.
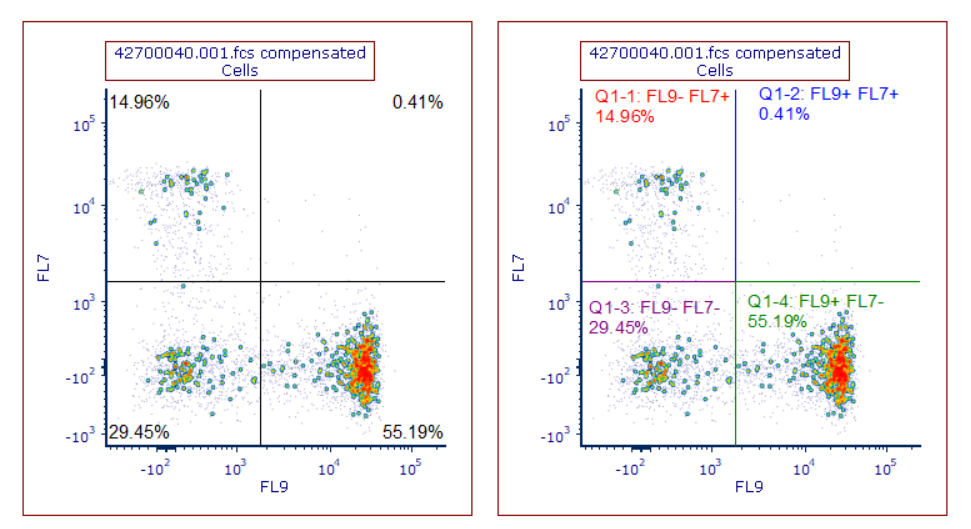
Graphically speaking, the Quadrant Set is depicted by default by two black lines crossing each other in the quadrant center-point (Figure 7.42, left pane). Each individual Quadrant Gate is depicted as a 4 angles polygon gate (Figure below, right pane).

Figure 7.43 Graphical representation of Quadrant Set (on the left) and Quadrant Gates (on the right).
Quadrant Sets and Quadrant gates can be shown/hidden at user convenience by right-clicking on the plot of interest and selecting Quadrants or Show Gates respectively from the right-click menu.
Quadrant statistics displayed on the plot may be changed by formatting the Label Text Box containing the statistic.
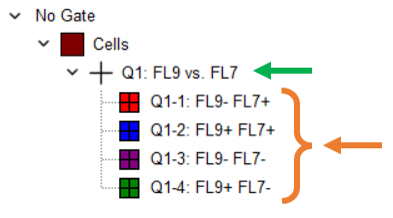
In the Gate View and the Gate Navigator, Quadrant Sets (green arrow in the figure below) and Quadrant gates (orange arrow in the figure below) are displayed hierarchically (Figure 7.43).

Figure 7.44 Hierarchical reperesentation of Quadrant Sets and Quadrant Gates in the Gate View (or in Gate Navigator).
In the next chapters, we will see:
•Create Quadrant/Quadrant Gates, and Compound Quadrants Gates
•Formatting Quadrant Set and Quadrant Gates
•Linking Quadrants to Quadrants
•Using Quadrants and the Clipboard
