Type of Quadrants
Quadrants are really flexible in FCS Express and their shape/behavior can be easily customized at your convenience. Different flavors of quadrants are briefly described below.
Standard Quadrants
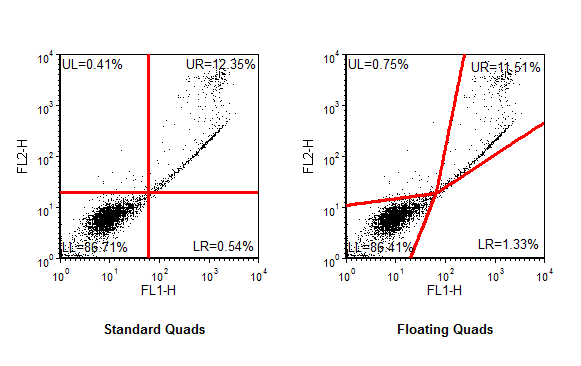
Standard quadrants are the quadrants found in most flow cytometry software packages. The data space is subdivided into four regions by four orthogonal lines (Figure 7.44, left pane). The resulting four quadrants are square or rectangular and are entirely defined by the central vertex. Moving the central vertex of the quadrants will redefine all four quadrants.
When quadrants are created in FCS Express, they are defaulted to this setting.
Floating Quadrants
With floating quadrants, the data space is still subdivided into four regions, however the four lines that define them can be angled (right pane in the picture below). The resulting four quadrants are thus allowed to be non-rectangular. Their shape is defined by the central vertex and by the four vertices, whose positions can be customized individually.
Floating quadrants allow the user to quickly and easily get statistics on populations that cannot be demarcated by standard quadrants. This can eliminate the need for compensation when only percentages are needed.
In FCS Express, quadrants can be made floating quadrants by using the Floating options in the Edit quadrants dialog.

Figure 7.45 Standard vs Floating Quads
Percentile Quadrants
Percentile Quadrants are similar to standard quadrants (please see above) except that either one or both the coordinates of the central vertex (the centerpoint) are automatically calculated based on percentiles.
In Percentile Quadrants, the centerpoint is defined by percentile tokens. In most scenarios the percentile is calculated using the parameter currently displayed on the plot of interest (i.e. the X coordinate of the centerpoint is set based on the Nth percentile of parameter displayed on the X axis on that plot). To set a quadrant according to percentiles in this way, the user can click Set Centerpoint as Percentiles options in the Selected Gate or Quadrant Properties category of the plot's formatting menu.
In the Selected Gate or Quadrant Properties category of the plot's formatting menu, under Centerpoint, you can alternatively click the ![]() button to set the centerpoint according to a desired percentile tokens. With this method, FCS Express allows you to ideally use any parameter from any plot as input data for percentile calculation (i.e. the X coordinate of the centerpoint is set based on the Nth percentile of the parameter displayed on any axis on any plot in the layout).
button to set the centerpoint according to a desired percentile tokens. With this method, FCS Express allows you to ideally use any parameter from any plot as input data for percentile calculation (i.e. the X coordinate of the centerpoint is set based on the Nth percentile of the parameter displayed on any axis on any plot in the layout).
Once the percentile is defined, the coordinates of the centerpoint will automatically update as the input data used to set the percentile changes. For instance, if you set the centerpoint X coordinate be at the 99th %ile of the parameter displayed on the X axis of that plot, the centerpoint X coordinate will automatically update so the centerpoint is always at the channel where 99% of the events are below it.
Percentile quadrants can be set on plots displaying control data and then be displayed on plots displaying your sample data. Alternatively, you can link the quadrants on a plot displaying sample data to a plot displaying the control. Quad linking is described in the section on Linking Quadrants to Quadrants.
Important Note: In FCS Express 7.20 and later, the Floating and the Percentile option can be active at the same time. However, the Percentile option only applies to the centerpoint, and not to the four vertices (which might be misaligned when Angles are used). We thus discourage setting quadrants with both those options active, since non-orthogonal angles will introduce discrepancies between the chosen percentile and the percentage of events that will be actually calculated in the resulting non-orthogonal quadrants.
Linked Quadrants
Beginning in FCS Express 7.20, Quadrants are gates by default and are thus defined by:
•a pair of parameters (i.e. the two parameters displayed on the plot where they were created)
•a parent gate (i.e. the parent gate can either be the overlay gate of the plot the Quadrants were created on, or any custom gate of the hierarchy chosen by the User)
If two plots display the same parameters and the same overlay gate, there is no need to create additional quadrants and then link them. Simply, right-click on the second plot and choose the Quadrants option to show the quadrant of interest.
If two plots display different parameters and/or different overlay gates you can created linked quadrants. When one of the linked quads is moved, the other linked quads will be updated automatically.
