Gates To Display
The Gates to Display formatting options are for setting which gates to use to color events. Gate display functions are available for dot plots, color dot plots, spectrum plots and scatter plots.
Note: You can also choose which gates to display in a Data Grid and in a 2D Plot Statistics Table.
Note: If you have one overlay on a Dot Plot, the dots are shown in the gate color. If you have more than one overlay, the colors will reflect the different overlays, which are specified in the Overlays section of the Format window.
You can edit the Gates to Display in one of two ways:
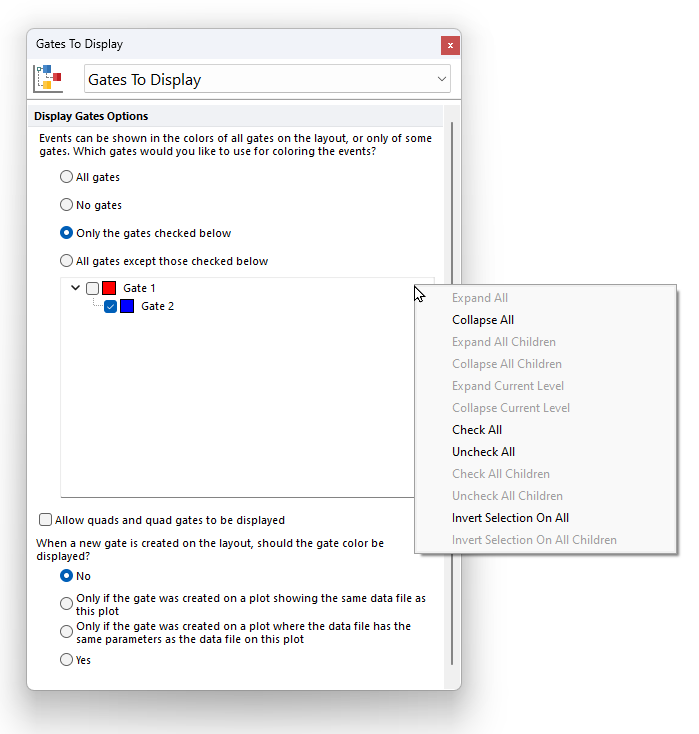
•Select the plot(s) and use the Format→Data Options→Gates to Display command (Figure 5.49).
•Right-click on the plot, select Format from the pop-up menu, and choose Gates to Display from the drop-down.

Figure 5.49 The Gates to Display formatting dialog for a 2D plot.
By default, the All Gates option is selected. However, you can select Only the gates checked below and then select the gates whose colors you wish to display. Alternatively, select All gates except those checked below and then choose the gates whose colors you do not wish to display.
A right-click menu is available within the Gate to Display dialog as displayed in the figure above. The right click menu allows users to:
▪Expand/collapse All gates
▪Expand/Collapse All Children gates within the selected gate
▪Expand/Collapse Current Level (this expand only the first level of children gates within the selected gate)
▪Check/Uncheck All gates
▪Check/Uncheck All Children gates within the selected gate
▪Invert Selection on All gates
▪Invert Selection on All Children gates within the selected gate
Allow quads and quad gates to be displayed. Check or uncheck this option to show or hide the color of quadrants and quadrant gates in the 2D plot.
When a new gate is created on the layout, should it be included in this Gate View? This option allows to choose how to display the gate color when a new gate is created on the layoutis. This option is only available when the option Only the gates checked below is checked. The No option will be the default selection. However, you can change this setting if preferred. Possible choices are:
•No
•Display the gate color on a back-gated plot Only if the new gate was created on a plot showing the same data file as this plot (as the plot where the new gate was created),
•Display the gate color on a back-gated plot Only if the new gate was created on a plot where the data file has the same parameters as the data file as this plot (as the plot where the new gate was created).
•Yes
