Gating with Picture Plots
In the course of this section, you will learn how to:
•Gate on a picture plot
•Adjust picture plot options for viewing gates
•Backgate from picture plots to scatter plots and from scatter plots to picture plots
•View statistics from picture plot gates
Note: In this section we will be using files ending in the .dns file format in a new layout. Picture plots may be inserted using a variety of file formats depending on your analysis instrument and export format.
Gating on and applying a gate to a picture plot is are the same behaviors for other plot types used in FCS Express. For an introduction to gating, please see the Gating tutorial.
1.Click File tab→New→New.
2.Choose the Data tab→Organize Data Sets group→Data List command. A Data List window will appear.
3.Click the blue plus to add files ![]() to select Add Data File.
to select Add Data File.
4.Choose DNS data Stream files (*.dns) from the Files of type: drop-down list.
5. Navigate to the FCS Express Tutorial Sample Data archive.
6. Select pictureplotsample1.dns.
7. Choose DNS data Stream files (*.dns) from the Files of type: drop-down list.
8. Click Open to load it into the Data List.
9. Drag and drop pictureplotsample1.dns by the file name from the Data List to the blank, white space of layout.
10. Select Color Dot and Picture Plot in the Select Plot Types... dialog (Figure T29.11).
11. Click OK.
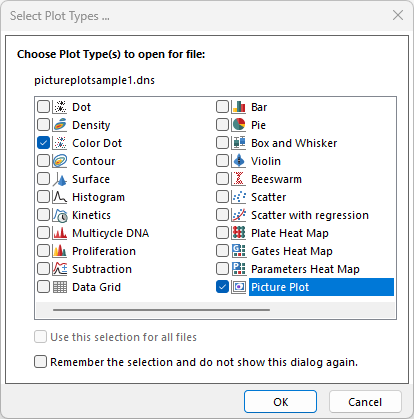
Figure T29.11 Choosing to Insert a Picture Plot and Color Dot Plot
A color dot plot and a picture plot for the file will appear on the layout. Click and drag borders of the plots to arrange them side-by-side as in Figure T29.12
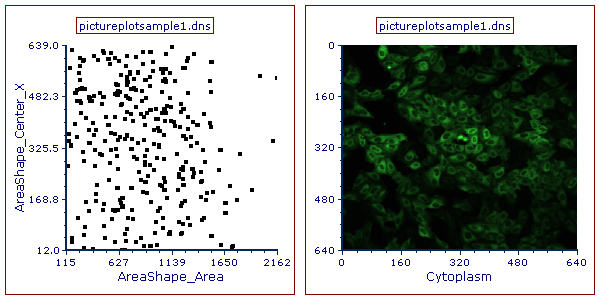
Figure T29.12 Arrangement of the Picture and Color Dot Plots
12. Create a rectangle gate on the picture plot, similar to the one in Figure T29.13 and name it Picture Plot Gate 1 in the Create New Gate dialog.
13. Create another gate (ellipse gate) on the picture plot similar to the one in Figure T29.13, and name it Picture Plot Gate 2 in the Create New Gate dialog.
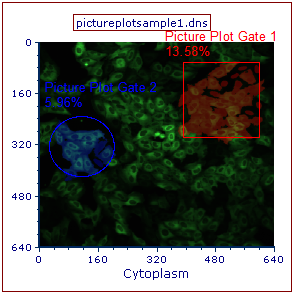
Figure T29.13 Creating Gates on the Picture Plot
Notice, on the picture plot, how the events are highlighted the same color as the gate in which they are contained by its bounds (Figure T29.13). Also, note that the color dot plot is now displaying the events within picture plot gates in different colors. At times, it may be difficult to differentiate colors or events on the dot plot due to the nature of a single image experiment having a limited number of events.
We will format the dot plot to make it easier to view and analyze.
14. Double-click the color dot plot. The Formatting dialog will appear, docked to the right.
15. Choose the Overlays category in the Formatting dialog.
16. Change the Dot size to 5 (Figure T29.14, red outline).
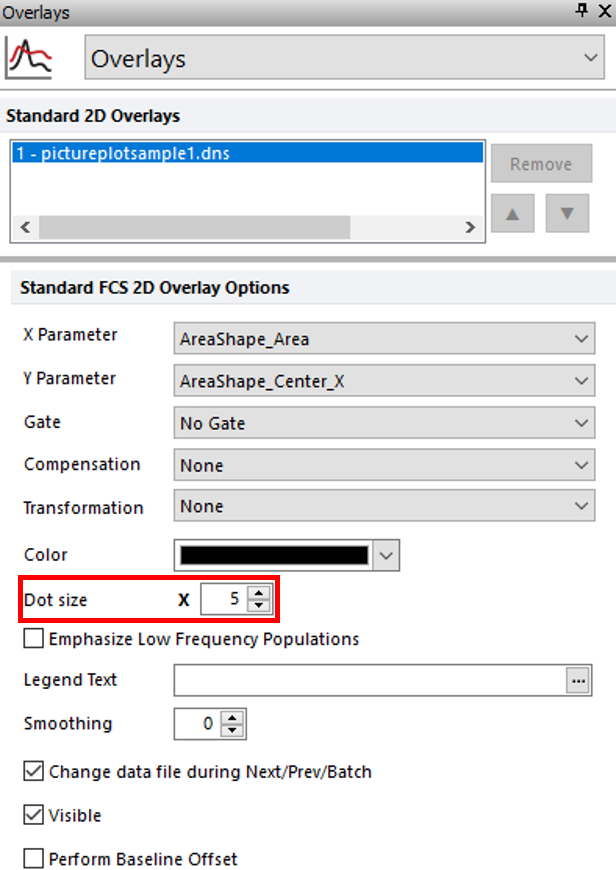
Figure T29.14 Formatting Dot Size for Color Dot Plot
The dot plot will resemble Figure T29.15.
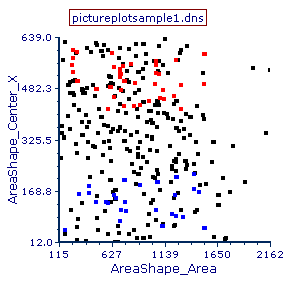
Figure T29.15 Color Dot Plot with Larger Dots
We now will format the picture plot to only highlight cells contained within bounds of only one gate.
17. Click the picture plot to select it.
18. In the Formatting dialog, select the Display Gates Options category.
19. Choose the radio button next to All gates except those checked below option (Figure T29.16, red arrow).
20. Check the box next to Picture Plot Gate 2 (Figure T29.16, red outline).
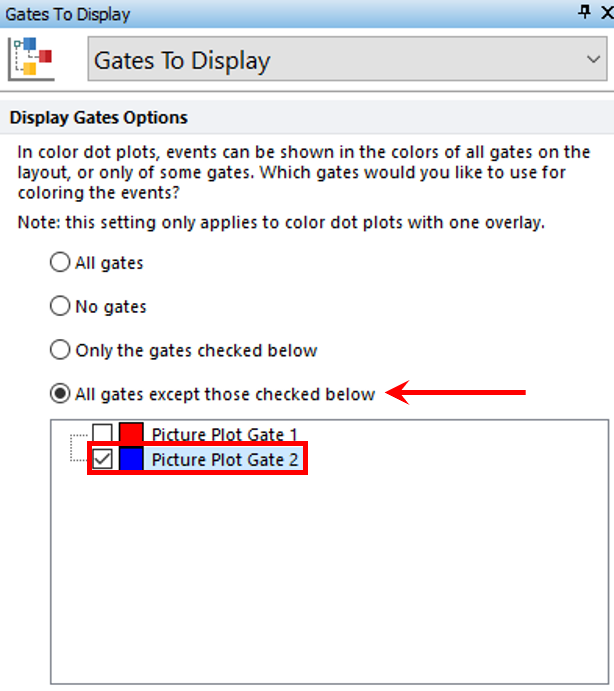
Figure T29.16 Choosing to Display All Gates Except Picture Plot Gate 2
The picture plot will resemble Figure T29.17.
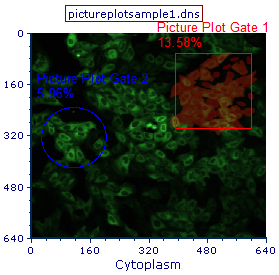
Figure T29.17 Picture Plot Highlighting Only Cells Contained Within Bounds of Picture Plot Gate 1
We will apply the Picture Plot Gate 1 gate to the color dot plot.
21. Click inside Picture Plot Gate 1 and hold mouse button down.
22. While holding mouse button down, drag gate from picture plot to color dot plot and release mouse button when color dot plot is outlined in blue (Figure T29.18).
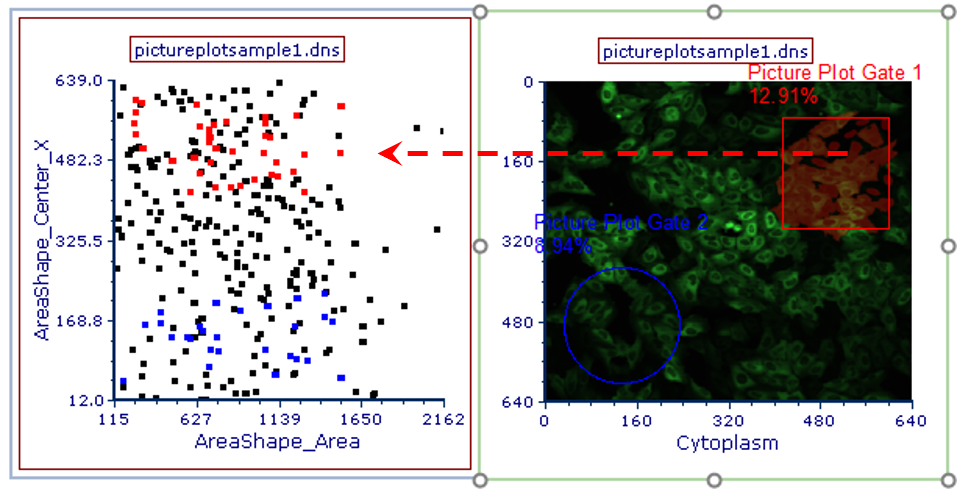
Figure T29.18 Applying Picture Plot Gate 1 to Color Dot Plot
Note how the color dot plot has changed to only display events that fall within the gate defined on the picture plot (Figure T29.19).
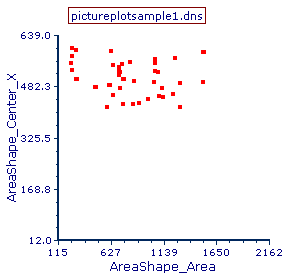
Figure 29.19 Color Dot Plot Displaying Cells from Picture Plot Gate 1
We will create a gate on the color dot plot and apply it to the picture plot.
23. Key Cmd+Z to undo the gating change, so the plot resembles Figure T29.15.
24. Create a rectangle gate on the color dot plot similar to Figure T29.20 and name it Dot Plot Gate in the Create New Gate dialog.
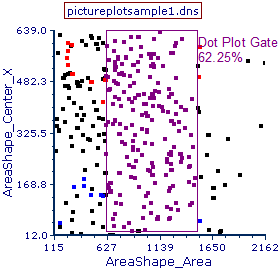
Figure T29.20 Creating Dot Plot Gate
Note how the picture plot is highlighting cells in the color of the Dot Plot Gate now (Figure T29.21). Adjust the Dot Plot Gate and observe the highlighting changes on the picture plot to indicate events in the gate with its movement. This gating strategy may be particularly useful for identifying interesting populations of cells in an image based on numerical results.
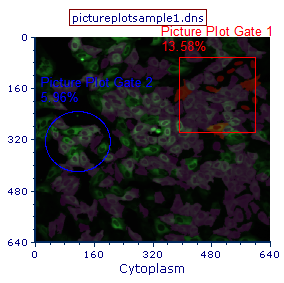
Figure T29.21 Picture Plot Displaying the Dot Plot Gated Events in Purple
The individual cells that fall within the dot plot gate can also be shown in the picture plot by removing the background image.
25. Click the picture plot.
26. Choose the Overlays category in the Formatting dialog.
27. Uncheck the box next to Show Background Image option (Figure T29.3).
28. Click Gating tab→ Create Gates category→Current Gate drop-down and choose Dot Plot Gate.
The picture plot will resemble Figure T29.22, displaying only the cells found within the Dot Plot Gate.
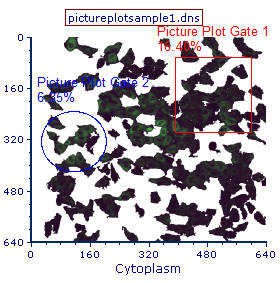
Figure T29.22 Picture Plot with Dot Plot Gate Applied
Next, we will use data grids for image analysis.
