Import ImageXpress VelosTM Data with Images
After adjusting the export settings and analyzing your data in ImageXpress Velos, you may proceed to import the data into FCS Express.
The ImageXpress Velos files used for this section are located in the Tutorial Sample Data archive.
1.Select File tab→Options→expand Data Loading category→choose ImageXpress Velos Options.
2.Check the Load images check box.
3.Check the Load as Plate check box.
4.Click OK.
The ImageXpress Velos options page of the Data Loading preferences should match Figure T28.2.
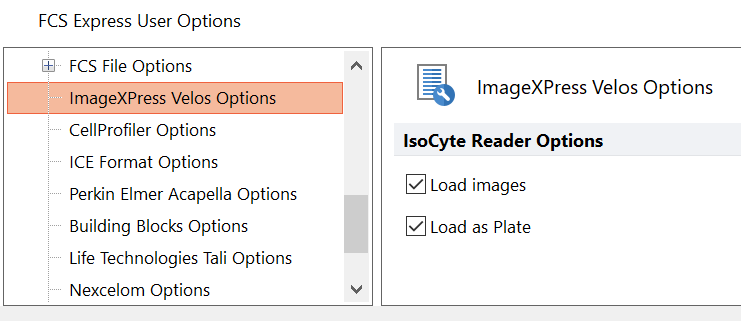
Figure T28.2 Setting up ImageXpress Velos Data Loading Preferences in FCS Express
5.Select File tab→New→New to open a new layout if necessary.
6.Select the Insert tab→Other Plots group→Plate Heat Map command (Figure T28.3).
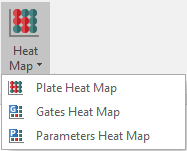
Figure T28.3 InsertingP Plate Heat Map from Ribbon
6.Click anywhere on the layout.
7.Choose ImageXpress Velos files (*.iso) from the files of type: drop-down list in the Select data file dialog (Figure T28.4).
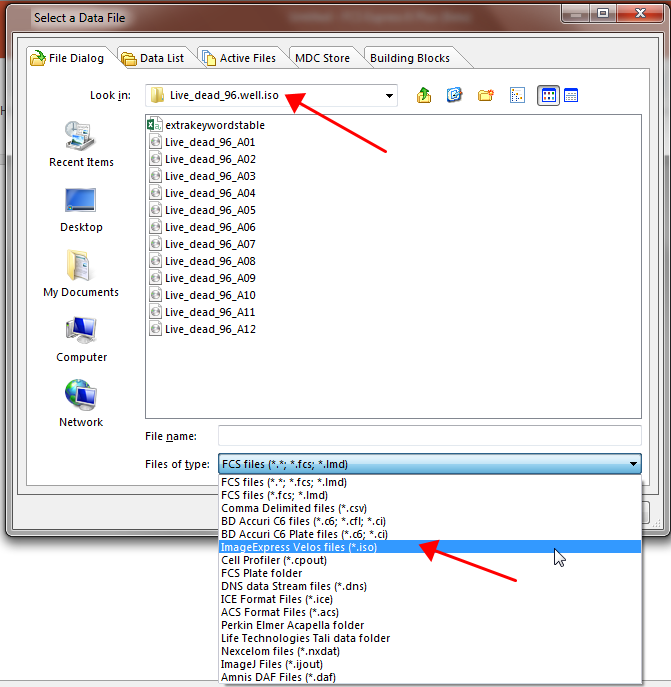
Figure T25.4 Choosing an ImageXpress Velos file for a Heat Map
8. Navigate to the Sample Data→ImageXpress Velos With Images→Live_dead_96.well.iso folder.
9. Highlight the Live_dead_96_A01.iso file in the list.
10. Click Open.
A plate heat map containing your data set will appear indicating your import was successful (Figure T28.5). The data set we are using in this section only contains one row of samples.
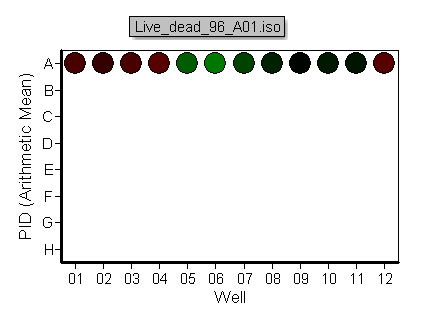
Figure T28.5 Plate Heat Map Generated from ImageXpress Velos Data
To view the images associated with each well"
11. Insert a Picture Plot by choosing Insert tab→Other Plots group→Picture Plot command  .
.
12. Click anywhere on the layout.
A picture plot will appear on the layout (Figure T28.7). The picture plot is now displaying all the image from the first well in the plate. We will now create a well gate and apply it to the picture plot to display the image associated with a particular well.
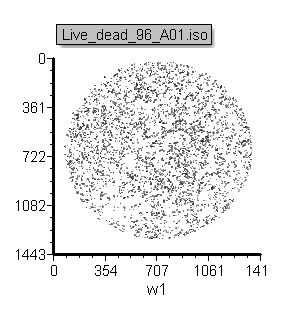
Figure T28.7 Picture Plot Displaying Image from Well A01
13. Create a Well Gate for well A6 on your plate heat map (Figure T28.8).
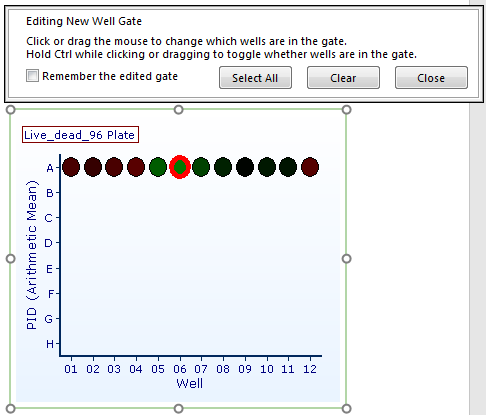
Figure T28.8 Creating a Well Gate on Plate Heat Map
14. Apply the Well Gate from the last step to the Picture Plot (Figure T28.9). For more information about applying gates, see the Gating tutorial.
The picture plot should resemble Figure T28.9, right.
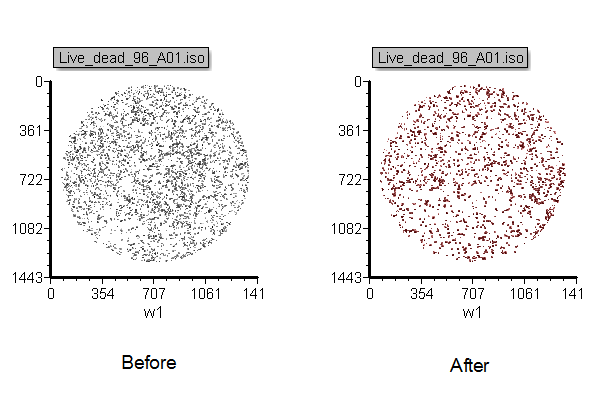
Figure T28.9 Picture Plot Before (left) and After (right) Applying Well Gate
The image displayed in the picture plot now is based on the well gate that was defined. Editing the Well Gate and selecting different wells will change the image in the picture plot.
In the next section, we will set up ImageXpress Velos to export an experiment in numeric form (data only).
