Overlay and Format Kinetics Plots
Often, it is useful to view many samples on the same plot to see sample variation and to compare experimental samples against a control. In this tutorial, you will learn how to overlay multiple kinetics samples, apply parameter math to the overlays, and format the overlays to make the data easier to view.
Although any kinetics data files of your own can be used to follow along, you have the option of using the same sample data files used in this tutorial. The sample data files are located in the Tutorial Sample Data archive. The KineticsTutorialFormatting.fey, kinetics8.008, kinetics9.009, kinetics10.010, and kinetics25.025 data files will be used here.
1. Select File tab→Open Layout.
2. Select the KineticsTutorialFormatting.fey layout file located in the Tutorial Sample Data directory.
3.Load the data files when prompted by the Select the Data Directory dialog.
The layout contains one kinetics plot displaying Time vs Fluo 3 for sample kinetics25.025. We will now add the other three samples to the kinetics plot as overlays.
4. Cmd+Click on samples kinetics8.008, kinetics9.009, and kinetics10.010 to select them in the data list.
5. Click and hold the mouse button while hovering over file name of the files in the Data List. While holding mouse button down, drag from the data list and drop onto the Kinetics plot.
6. Release the mouse button to drop them on the plot.
7.Choose add the files to the plot as new overlays option in the Select Drag and Drop Action dialog.
8.Click OK.
The four samples are displayed simultaneously in the kinetics plot. Though, the Parameter Math transformation is not yet applied to the plot. We will now apply the Parameter Math transformation to the plot via drag and drop.
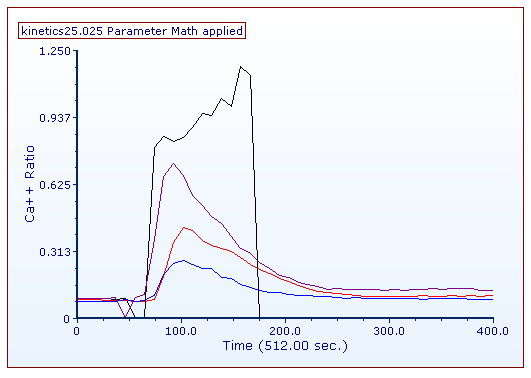
The plot now contains overlays for all samples and should resemble T23.20.

Figure T23.20 Multiple Kinetics Overlays
We now will format the plot to make it more visually appealing.
9.Click and hold the mouse button on the New Parameter Math transformation from the Transformation window.
10.While holding mouse button, drag the New Parameter Math transformation out of the Transformation window and drop it on top of the kinetics plot (Figure T23.5). The Parameter Math applied suffix will be added to the plot title as a confirmation of this action.
11. Change the Y-Axis parameter on the Kinetics Overlay plot to Ca++ Ratio.
12. Select the Live Cells gate from Gating tab→Create Gates group→Current Gate drop-down list on ribbon.
13. Double-click the kinetics plot. The Formatting dialog will appear, docked to the right.
14. Choose the Overlays category.
15. Enter Cmd+Click on all the overlays in the Overlays List.
16. Change Line Options→Width to 1.50.
17. Choose the Legend category.
18. Click on the Visible check box to select it.
19. Change the Position from Right to Bottom.
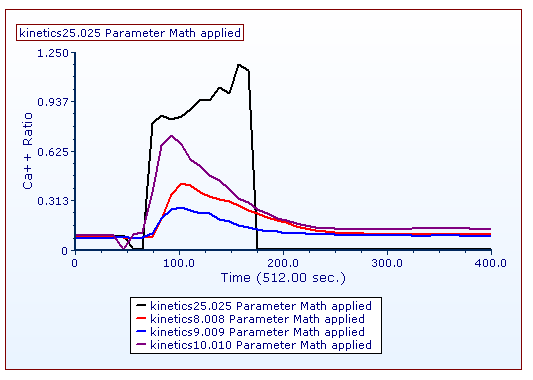
The plot should resemble Figure T23.21.

Figure T23.21 Kinetics Plots Formatted
Finally, we will change the resolution of a kinetics plot.
