Percent Gated - Parent and Percent Gated - Grandparent
The statistics % Gated - Parent and % Gated - Grandparent are available in FCS Express.
See also % of custom denominator gate for 1D- and 2D plots.
These are defined as follows:
% Gated - Parent |
The number of gated events divided by the number of events of the parent of the gate that is applied to a plot, multiplied by 100. |
% Gated - Grandparent |
The number of gated events divided by the number of events of the grandparent of the gate that is applied to a plot, multiplied by 100. |
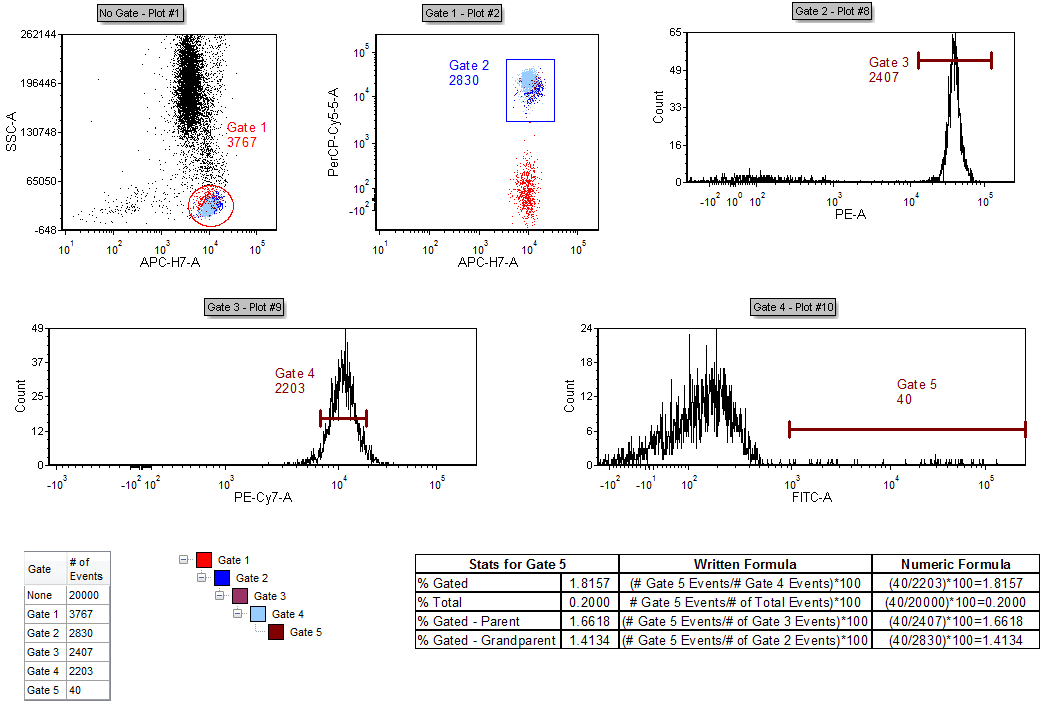
We will examine these statistics in terms of real data. Figure 11.9 represents an analysis with sequential gating.

Figure 11.10 - Analysis with Sequential Gating
When observing Gate 5... In Plot #10 (the lower right 1D histogram), there is a Marker that was converted to Gate 5. Gate 5 contains 40 events.
The gate that is applied to Plot #10 is Gate 4. Therefore, the statistic for Gate 5 % Gated is defined as the number of Gate 5 events (40) divided by the number of Gate 4 events (2203) multiplied by 100. In this case, the numerical formula is (40/2203)x100, which equals 1.8157.
The statistic for Gate 5 % Total is defined as the number of Gate 5 events (40) divided by the Total Number of events collected (20,000). The numerical formula is (40/20000)x100, which equals 0.2.
The statistic for Gate 5 % of Gated - Parent is defined as the number of gated events (40) divided by the number of events for the parent of the gate applied to Plot #10. As can be seen in Figure 11.10, Gate 4 has been applied to Plot #10. The parent of Gate 4 is Gate 3. So, the statistic for Gate 5 % of Gated - Parent is defined as the number of Gate 5 events divided by the number of Gate 3 events multiplied by 100. The numerical formula is (40/2407)x100, which equals 1.6618.

Figure 11.11 - Showing the Parent and Grandparent of Gate 4
The statistic for Gate 5 % of Gated - Grandparent is defined as the number of gated events (40) divided by the number of events for the grandparent of the gate applied to Plot #10. As can be seen in Figure 2, Gate 4 has been applied to Plot #10. The parent of Gate 4 is Gate 3. The parent of Gate 3 is Gate 2. So, the statistic for Gate 5 % of Gated - Grandparent is defined as the number of Gate 5 events divided by the number of Gate 2 events multiplied by 100. The numerical formula is (40/2830)x100, which equals 1.4134.
